
 Yahoo Finance
 Does Medtronic plc's (NYSE:MDT) P/E Ratio Signal A Buying Opportunity?

This article is written for those who want to get better at using price to earnings ratios (P/E ratios). We'll look at Medtronic plc's (NYSE:MDT) P/E ratio and reflect on what it tells us about the company's share price. What is Medtronic's P/E ratio? Well, based on the last twelve months it is 31.47. That means that at current prices, buyers pay $31.47 for every $1 in trailing yearly profits.
See our latest analysis for Medtronic
How Do I Calculate Medtronic's Price To Earnings Ratio?
The formula for P/E is:
Price to Earnings Ratio = Share Price ÷ Earnings per Share (EPS)
Or for Medtronic:
P/E of 31.47 = $111.72 ÷ $3.55 (Based on the trailing twelve months to October 2019.)
Is A High Price-to-Earnings Ratio Good?
A higher P/E ratio means that investors are paying a higher price for each $1 of company earnings. That isn't necessarily good or bad, but a high P/E implies relatively high expectations of what a company can achieve in the future.
How Does Medtronic's P/E Ratio Compare To Its Peers?
One good way to get a quick read on what market participants expect of a company is to look at its P/E ratio. If you look at the image below, you can see Medtronic has a lower P/E than the average (45.8) in the medical equipment industry classification.
This suggests that market participants think Medtronic will underperform other companies in its industry. Many investors like to buy stocks when the market is pessimistic about their prospects. If you consider the stock interesting, further research is recommended. For example, I often monitor director buying and selling.
How Growth Rates Impact P/E Ratios
Generally speaking the rate of earnings growth has a profound impact on a company's P/E multiple. If earnings are growing quickly, then the 'E' in the equation will increase faster than it would otherwise. And in that case, the P/E ratio itself will drop rather quickly. A lower P/E should indicate the stock is cheap relative to others -- and that may attract buyers.
In the last year, Medtronic grew EPS like Taylor Swift grew her fan base back in 2010; the 120% gain was both fast and well deserved. Having said that, the average EPS growth over the last three years wasn't so good, coming in at 5.3%.
A Limitation: P/E Ratios Ignore Debt and Cash In The Bank
The 'Price' in P/E reflects the market capitalization of the company. Thus, the metric does not reflect cash or debt held by the company. Hypothetically, a company could reduce its future P/E ratio by spending its cash (or taking on debt) to achieve higher earnings.
Spending on growth might be good or bad a few years later, but the point is that the P/E ratio does not account for the option (or lack thereof).
So What Does Medtronic's Balance Sheet Tell Us?
Medtronic has net debt worth 10% of its market capitalization. It would probably deserve a higher P/E ratio if it was net cash, since it would have more options for growth.
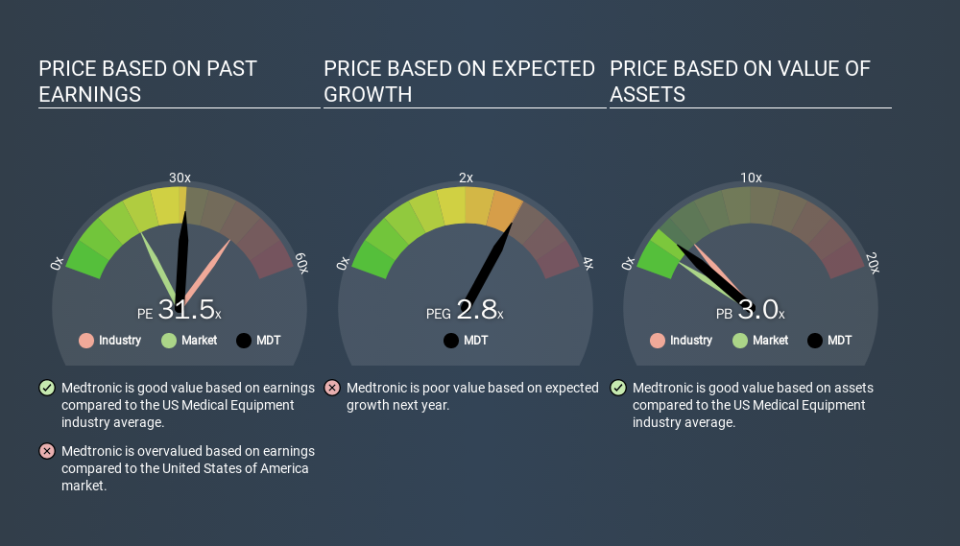
The Bottom Line On Medtronic's P/E Ratio
Medtronic trades on a P/E ratio of 31.5, which is above its market average of 18.4. Its debt levels do not imperil its balance sheet and its EPS growth is very healthy indeed. So on this analysis a high P/E ratio seems reasonable.
Investors have an opportunity when market expectations about a stock are wrong. People often underestimate remarkable growth -- so investors can make money when fast growth is not fully appreciated. So this free visualization of the analyst consensus on future earnings could help you make the right decision about whether to buy, sell, or hold.
You might be able to find a better buy than Medtronic. If you want a selection of possible winners, check out this free list of interesting companies that trade on a P/E below 20 (but have proven they can grow earnings).
If you spot an error that warrants correction, please contact the editor at editorial-team@simplywallst.com. This article by Simply Wall St is general in nature. It does not constitute a recommendation to buy or sell any stock, and does not take account of your objectives, or your financial situation. Simply Wall St has no position in the stocks mentioned.
We aim to bring you long-term focused research analysis driven by fundamental data. Note that our analysis may not factor in the latest price-sensitive company announcements or qualitative material. Thank you for reading.
