
 Yahoo Finance
 Does Millennium & Copthorne Hotels plc’s (LON:MLC) PE Ratio Signal A Buying Opportunity?

The content of this article will benefit those of you who are starting to educate yourself about investing in the stock market and want to better understand how you can grow your money by investing in Millennium & Copthorne Hotels plc (LON:MLC).
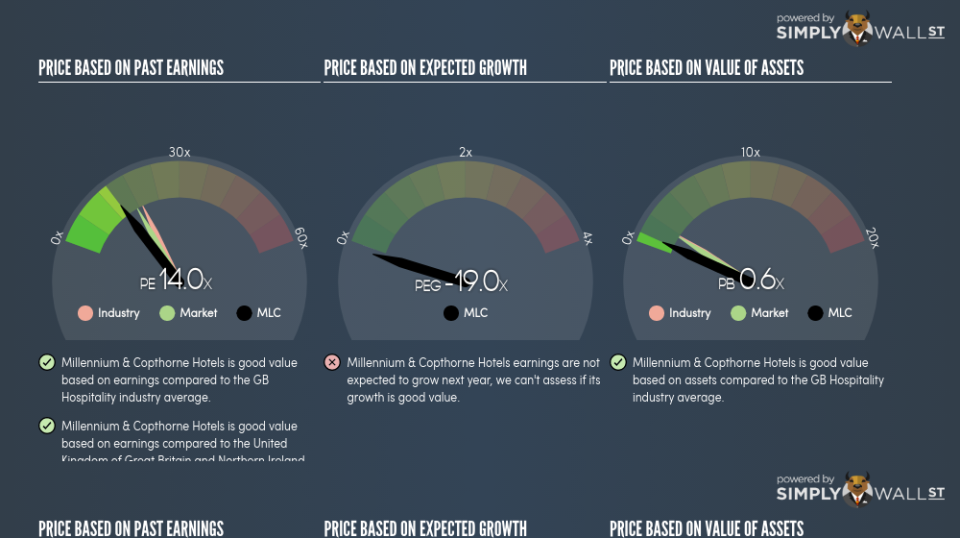
Millennium & Copthorne Hotels plc (LON:MLC) trades with a trailing P/E of 14x, which is lower than the industry average of 19x. While this makes MLC appear like a great stock to buy, you might change your mind after I explain the assumptions behind the P/E ratio. Today, I will deconstruct the P/E ratio and highlight what you need to be careful of when using the P/E ratio. View out our latest analysis for Millennium & Copthorne Hotels
Breaking down the P/E ratio
The P/E ratio is one of many ratios used in relative valuation. It compares a stock’s price per share to the stock’s earnings per share. A more intuitive way of understanding the P/E ratio is to think of it as how much investors are paying for each dollar of the company’s earnings.
P/E Calculation for MLC
Price-Earnings Ratio = Price per share ÷ Earnings per share
MLC Price-Earnings Ratio = £5.34 ÷ £0.382 = 14x
The P/E ratio itself doesn’t tell you a lot; however, it becomes very insightful when you compare it with other similar companies. We want to compare the stock’s P/E ratio to the average of companies that have similar characteristics as MLC, such as size and country of operation. One way of gathering a peer group is to use firms in the same industry, which is what I’ll do. Since MLC’s P/E of 14x is lower than its industry peers (19x), it means that investors are paying less than they should for each dollar of MLC’s earnings. As such, our analysis shows that MLC represents an under-priced stock.
A few caveats
Before you jump to the conclusion that MLC is the perfect buying opportunity, it is important to realise that our conclusion rests on two assertions. Firstly, our peer group contains companies that are similar to MLC. If this isn’t the case, the difference in P/E could be due to other factors. For example, if you compared lower risk firms with MLC, then investors would naturally value it at a lower price since it is a riskier investment. The second assumption that must hold true is that the stocks we are comparing MLC to are fairly valued by the market. If this does not hold, there is a possibility that MLC’s P/E is lower because our peer group is overvalued by the market.
What this means for you:
Since you may have already conducted your due diligence on MLC, the undervaluation of the stock may mean it is a good time to top up on your current holdings. But at the end of the day, keep in mind that relative valuation relies heavily on critical assumptions I’ve outlined above. Remember that basing your investment decision off one metric alone is certainly not sufficient. There are many things I have not taken into account in this article and the PE ratio is very one-dimensional. If you have not done so already, I highly recommend you to complete your research by taking a look at the following:
Future Outlook: What are well-informed industry analysts predicting for MLC’s future growth? Take a look at our free research report of analyst consensus for MLC’s outlook.
Past Track Record: Has MLC been consistently performing well irrespective of the ups and downs in the market? Go into more detail in the past performance analysis and take a look at the free visual representations of MLC’s historicals for more clarity.
Other High-Performing Stocks: Are there other stocks that provide better prospects with proven track records? Explore our free list of these great stocks here.
To help readers see pass the short term volatility of the financial market, we aim to bring you a long-term focused research analysis purely driven by fundamental data. Note that our analysis does not factor in the latest price sensitive company announcements.
The author is an independent contributor and at the time of publication had no position in the stocks mentioned.
