
 Yahoo Finance
 What Does Mirada Plc's (LON:MIRA) Balance Sheet Tell Us About It?

Want to participate in a short research study? Help shape the future of investing tools and you could win a $250 gift card!
While small-cap stocks, such as Mirada Plc (LON:MIRA) with its market cap of UK£8.7m, are popular for their explosive growth, investors should also be aware of their balance sheet to judge whether the company can survive a downturn. Since MIRA is loss-making right now, it’s essential to understand the current state of its operations and pathway to profitability. The following basic checks can help you get a picture of the company's balance sheet strength. However, this is just a partial view of the stock, and I’d encourage you to dig deeper yourself into MIRA here.
Does MIRA Produce Much Cash Relative To Its Debt?
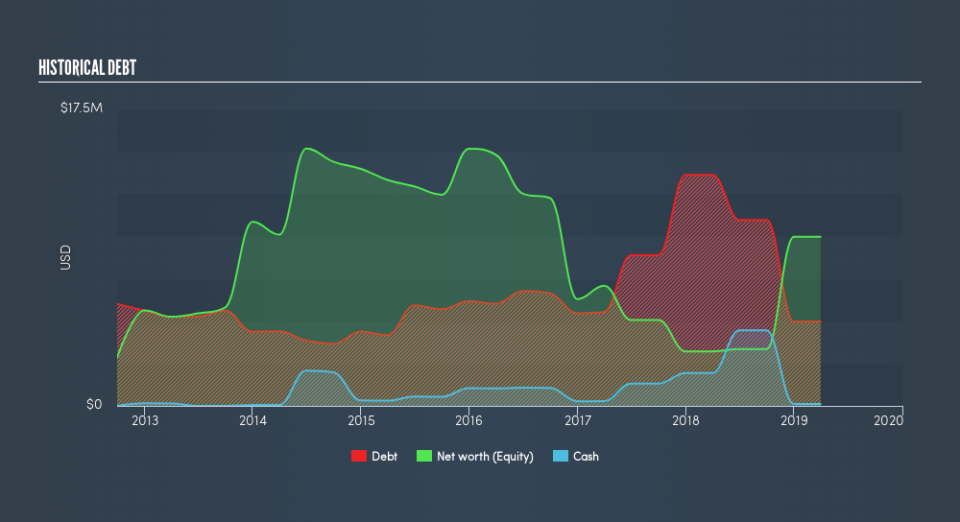
MIRA's debt levels have fallen from US$14m to US$5.0m over the last 12 months , which includes long-term debt. With this reduction in debt, MIRA currently has US$117k remaining in cash and short-term investments , ready to be used for running the business. Its negative operating cash flow means calculating cash-to-debt wouldn't be useful. As the purpose of this article is a high-level overview, I won’t be looking at this today, but you can examine some of MIRA’s operating efficiency ratios such as ROA here.
Can MIRA meet its short-term obligations with the cash in hand?
Looking at MIRA’s US$6.2m in current liabilities, it seems that the business may not be able to easily meet these obligations given the level of current assets of US$5.5m, with a current ratio of 0.89x. The current ratio is the number you get when you divide current assets by current liabilities.
Can MIRA service its debt comfortably?
With debt reaching 50% of equity, MIRA may be thought of as relatively highly levered. This is somewhat unusual for small-caps companies, since lenders are often hesitant to provide attractive interest rates to less-established businesses. Though, since MIRA is currently loss-making, there’s a question of sustainability of its current operations. Maintaining a high level of debt, while revenues are still below costs, can be dangerous as liquidity tends to dry up in unexpected downturns.
Next Steps:
Although MIRA’s debt level is towards the higher end of the spectrum, its cash flow coverage seems adequate to meet debt obligations which means its debt is being efficiently utilised. However, its lack of liquidity raises questions over current asset management practices for the small-cap. Keep in mind I haven't considered other factors such as how MIRA has been performing in the past. I recommend you continue to research Mirada to get a more holistic view of the stock by looking at:
Historical Performance: What has MIRA's returns been like over the past? Go into more detail in the past track record analysis and take a look at the free visual representations of our analysis for more clarity.
Other High-Performing Stocks: Are there other stocks that provide better prospects with proven track records? Explore our free list of these great stocks here.
We aim to bring you long-term focused research analysis driven by fundamental data. Note that our analysis may not factor in the latest price-sensitive company announcements or qualitative material.
If you spot an error that warrants correction, please contact the editor at editorial-team@simplywallst.com. This article by Simply Wall St is general in nature. It does not constitute a recommendation to buy or sell any stock, and does not take account of your objectives, or your financial situation. Simply Wall St has no position in the stocks mentioned. Thank you for reading.
