
 Yahoo Finance
 Does MKS Instruments, Inc.'s (NASDAQ:MKSI) CEO Salary Compare Well With Others?

In 2014 Jerry Colella was appointed CEO of MKS Instruments, Inc. (NASDAQ:MKSI). This analysis aims first to contrast CEO compensation with other companies that have similar market capitalization. Then we'll look at a snap shot of the business growth. Third, we'll reflect on the total return to shareholders over three years, as a second measure of business performance. This process should give us an idea about how appropriately the CEO is paid.
Check out our latest analysis for MKS Instruments
How Does Jerry Colella's Compensation Compare With Similar Sized Companies?
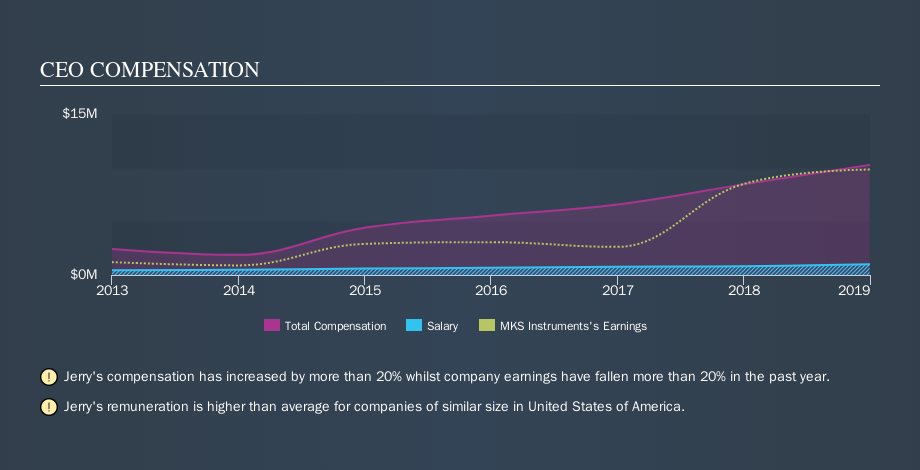
According to our data, MKS Instruments, Inc. has a market capitalization of US$5.0b, and paid its CEO total annual compensation worth US$10m over the year to December 2018. While this analysis focuses on total compensation, it's worth noting the salary is lower, valued at US$993k. Importantly, there may be performance hurdles relating to the non-salary component of the total compensation. When we examined a selection of companies with market caps ranging from US$4.0b to US$12b, we found the median CEO total compensation was US$6.8m.
Thus we can conclude that Jerry Colella receives more in total compensation than the median of a group of companies in the same market, and of similar size to MKS Instruments, Inc.. However, this doesn't necessarily mean the pay is too high. A closer look at the performance of the underlying business will give us a better idea about whether the pay is particularly generous.
You can see a visual representation of the CEO compensation at MKS Instruments, below.
Is MKS Instruments, Inc. Growing?
On average over the last three years, MKS Instruments, Inc. has grown earnings per share (EPS) by 34% each year (using a line of best fit). It saw its revenue drop 11% over the last year.
This demonstrates that the company has been improving recently. A good result. The lack of revenue growth isn't ideal, but it is the bottom line that counts most in business. You might want to check this free visual report on analyst forecasts for future earnings.
Has MKS Instruments, Inc. Been A Good Investment?
Boasting a total shareholder return of 93% over three years, MKS Instruments, Inc. has done well by shareholders. This strong performance might mean some shareholders don't mind if the CEO were to be paid more than is normal for a company of its size.
In Summary...
We compared total CEO remuneration at MKS Instruments, Inc. with the amount paid at companies with a similar market capitalization. Our data suggests that it pays above the median CEO pay within that group.
However, the earnings per share growth over three years is certainly impressive. In addition, shareholders have done well over the same time period. Considering this fine result for shareholders, we daresay the CEO compensation might be apt. CEO compensation is one thing, but it is also interesting to check if the CEO is buying or selling MKS Instruments (free visualization of insider trades).
Of course, you might find a fantastic investment by looking elsewhere. So take a peek at this free list of interesting companies.
We aim to bring you long-term focused research analysis driven by fundamental data. Note that our analysis may not factor in the latest price-sensitive company announcements or qualitative material.
If you spot an error that warrants correction, please contact the editor at editorial-team@simplywallst.com. This article by Simply Wall St is general in nature. It does not constitute a recommendation to buy or sell any stock, and does not take account of your objectives, or your financial situation. Simply Wall St has no position in the stocks mentioned. Thank you for reading.
