
 Yahoo Finance
 Does Moelis & Company's (NYSE:MC) P/E Ratio Signal A Buying Opportunity?

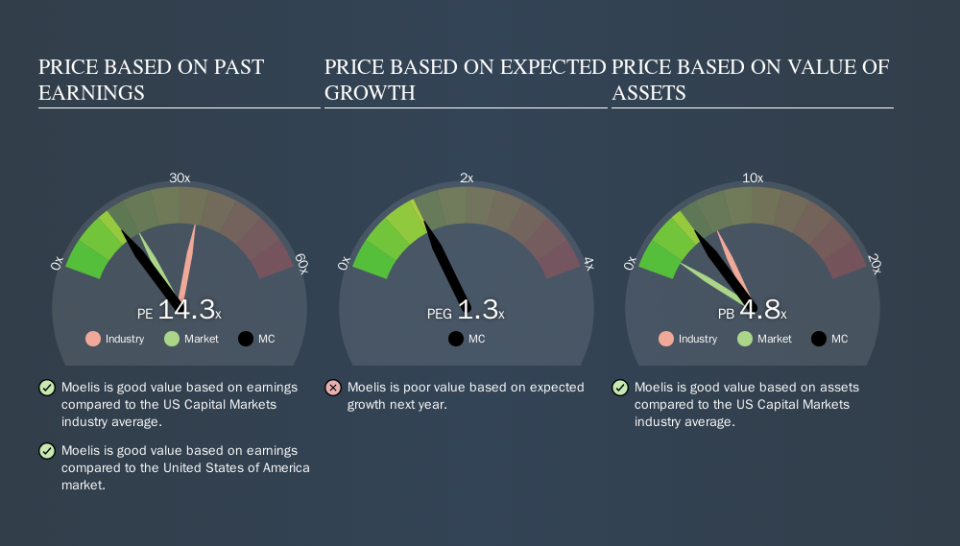
This article is written for those who want to get better at using price to earnings ratios (P/E ratios). We'll look at Moelis & Company's (NYSE:MC) P/E ratio and reflect on what it tells us about the company's share price. Moelis has a price to earnings ratio of 14.30, based on the last twelve months. That is equivalent to an earnings yield of about 7.0%.
See our latest analysis for Moelis
How Do You Calculate A P/E Ratio?
The formula for price to earnings is:
Price to Earnings Ratio = Price per Share ÷ Earnings per Share (EPS)
Or for Moelis:
P/E of 14.30 = $35.68 ÷ $2.50 (Based on the trailing twelve months to September 2019.)
Is A High P/E Ratio Good?
A higher P/E ratio means that buyers have to pay a higher price for each $1 the company has earned over the last year. That isn't necessarily good or bad, but a high P/E implies relatively high expectations of what a company can achieve in the future.
How Does Moelis's P/E Ratio Compare To Its Peers?
We can get an indication of market expectations by looking at the P/E ratio. The image below shows that Moelis has a lower P/E than the average (33.8) P/E for companies in the capital markets industry.
Moelis's P/E tells us that market participants think it will not fare as well as its peers in the same industry. Many investors like to buy stocks when the market is pessimistic about their prospects. It is arguably worth checking if insiders are buying shares, because that might imply they believe the stock is undervalued.
How Growth Rates Impact P/E Ratios
Generally speaking the rate of earnings growth has a profound impact on a company's P/E multiple. That's because companies that grow earnings per share quickly will rapidly increase the 'E' in the equation. That means unless the share price increases, the P/E will reduce in a few years. So while a stock may look expensive based on past earnings, it could be cheap based on future earnings.
Moelis increased earnings per share by a whopping 49% last year. And its annual EPS growth rate over 5 years is 12%. With that performance, I would expect it to have an above average P/E ratio.
A Limitation: P/E Ratios Ignore Debt and Cash In The Bank
One drawback of using a P/E ratio is that it considers market capitalization, but not the balance sheet. In other words, it does not consider any debt or cash that the company may have on the balance sheet. The exact same company would hypothetically deserve a higher P/E ratio if it had a strong balance sheet, than if it had a weak one with lots of debt, because a cashed up company can spend on growth.
Such expenditure might be good or bad, in the long term, but the point here is that the balance sheet is not reflected by this ratio.
Is Debt Impacting Moelis's P/E?
Moelis has net cash of US$108m. That should lead to a higher P/E than if it did have debt, because its strong balance sheets gives it more options.
The Verdict On Moelis's P/E Ratio
Moelis has a P/E of 14.3. That's below the average in the US market, which is 17.8. It grew its EPS nicely over the last year, and the healthy balance sheet implies there is more potential for growth. The below average P/E ratio suggests that market participants don't believe the strong growth will continue.
When the market is wrong about a stock, it gives savvy investors an opportunity. As value investor Benjamin Graham famously said, 'In the short run, the market is a voting machine but in the long run, it is a weighing machine. So this free report on the analyst consensus forecasts could help you make a master move on this stock.
You might be able to find a better buy than Moelis. If you want a selection of possible winners, check out this free list of interesting companies that trade on a P/E below 20 (but have proven they can grow earnings).
We aim to bring you long-term focused research analysis driven by fundamental data. Note that our analysis may not factor in the latest price-sensitive company announcements or qualitative material.
If you spot an error that warrants correction, please contact the editor at editorial-team@simplywallst.com. This article by Simply Wall St is general in nature. It does not constitute a recommendation to buy or sell any stock, and does not take account of your objectives, or your financial situation. Simply Wall St has no position in the stocks mentioned. Thank you for reading.
