
 Yahoo Finance
 Does The MYOS RENS Technology Inc. (NASDAQ:MYOS) Share Price Tend To Follow The Market?

If you own shares in MYOS RENS Technology Inc. (NASDAQ:MYOS) then it's worth thinking about how it contributes to the volatility of your portfolio, overall. In finance, Beta is a measure of volatility. Modern finance theory considers volatility to be a measure of risk, and there are two main types of price volatility. The first type is company specific volatility. Investors use diversification across uncorrelated stocks to reduce this kind of price volatility across the portfolio. The second type is the broader market volatility, which you cannot diversify away, since it arises from macroeconomic factors which directly affects all the stocks on the market.
Some stocks see their prices move in concert with the market. Others tend towards stronger, gentler or unrelated price movements. Some investors use beta as a measure of how much a certain stock is impacted by market risk (volatility). While we should keep in mind that Warren Buffett has cautioned that 'Volatility is far from synonymous with risk', beta is still a useful factor to consider. To make good use of it you must first know that the beta of the overall market is one. A stock with a beta below one is either less volatile than the market, or more volatile but not corellated with the overall market. In comparison a stock with a beta of over one tends to be move in a similar direction to the market in the long term, but with greater changes in price.
See our latest analysis for MYOS RENS Technology
What we can learn from MYOS's beta value
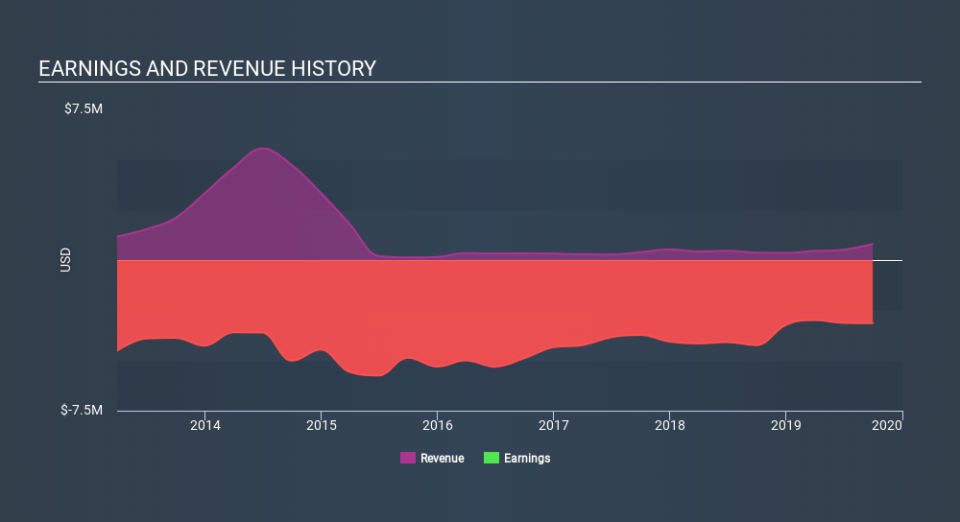
Given that it has a beta of 0.87, we can surmise that the MYOS RENS Technology share price has not been strongly impacted by broader market volatility (over the last 5 years). This suggests that including it in your portfolio will reduce volatility arising from broader market movements, assuming your portfolio's weighted average beta is higher than 0.87. Many would argue that beta is useful in position sizing, but fundamental metrics such as revenue and earnings are more important overall. You can see MYOS RENS Technology's revenue and earnings in the image below.
Could MYOS's size cause it to be more volatile?
With a market capitalisation of US$11m, MYOS RENS Technology is a very small company by global standards. It is quite likely to be unknown to most investors. Very small companies often have a low beta value because their share prices are not well correlated with market volatility. This could be because the price is reacting to company specific events. Alternatively, the shares may not be actively traded.
What this means for you:
Since MYOS RENS Technology is not heavily influenced by market moves, its share price is probably far more dependent on company specific developments. It could pay to take a closer look at metrics such as revenue growth, earnings growth, and debt. This article aims to educate investors about beta values, but it's well worth looking at important company-specific fundamentals such as MYOS RENS Technology’s financial health and performance track record. I highly recommend you dive deeper by considering the following:
Financial Health: Are MYOS’s operations financially sustainable? Balance sheets can be hard to analyze, which is why we’ve done it for you. Check out our financial health checks here.
Past Track Record: Has MYOS been consistently performing well irrespective of the ups and downs in the market? Go into more detail in the past performance analysis and take a look at the free visual representations of MYOS's historicals for more clarity.
Other High-Performing Stocks: Are there other stocks that provide better prospects with proven track records? Explore our free list of these great stocks here.
If you spot an error that warrants correction, please contact the editor at editorial-team@simplywallst.com. This article by Simply Wall St is general in nature. It does not constitute a recommendation to buy or sell any stock, and does not take account of your objectives, or your financial situation. Simply Wall St has no position in the stocks mentioned.
We aim to bring you long-term focused research analysis driven by fundamental data. Note that our analysis may not factor in the latest price-sensitive company announcements or qualitative material. Thank you for reading.
