
 Yahoo Finance
 How Does National Australia Bank's (ASX:NAB) P/E Compare To Its Industry, After The Share Price Drop?

To the annoyance of some shareholders, National Australia Bank (ASX:NAB) shares are down a considerable 31% in the last month. The recent drop has obliterated the annual return, with the share price now down 27% over that longer period.
All else being equal, a share price drop should make a stock more attractive to potential investors. In the long term, share prices tend to follow earnings per share, but in the short term prices bounce around in response to short term factors (which are not always obvious). So, on certain occasions, long term focussed investors try to take advantage of pessimistic expectations to buy shares at a better price. Perhaps the simplest way to get a read on investors' expectations of a business is to look at its Price to Earnings Ratio (PE Ratio). Investors have optimistic expectations of companies with higher P/E ratios, compared to companies with lower P/E ratios.
Check out our latest analysis for National Australia Bank
How Does National Australia Bank's P/E Ratio Compare To Its Peers?
We can tell from its P/E ratio of 10.29 that there is some investor optimism about National Australia Bank. You can see in the image below that the average P/E (8.3) for companies in the banks industry is lower than National Australia Bank's P/E.
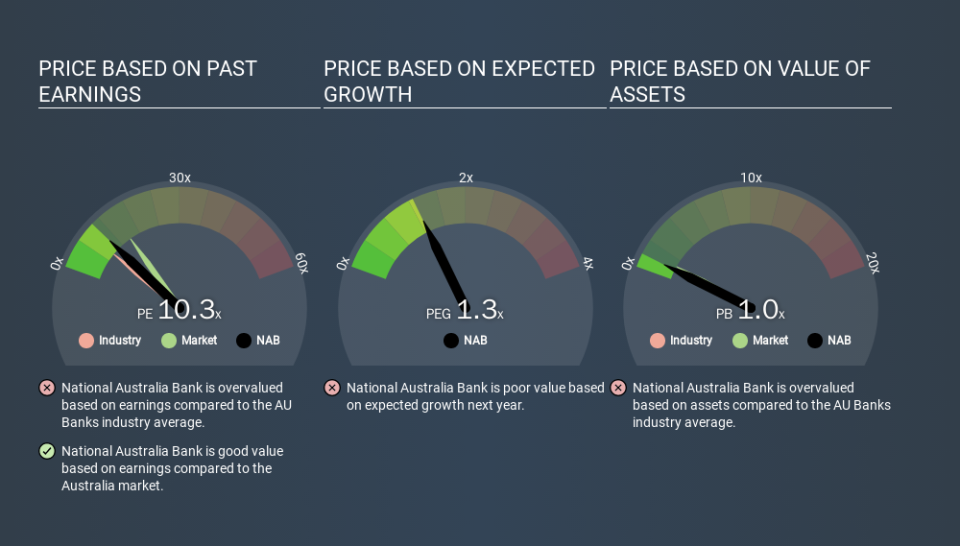
National Australia Bank's P/E tells us that market participants think the company will perform better than its industry peers, going forward. The market is optimistic about the future, but that doesn't guarantee future growth. So investors should always consider the P/E ratio alongside other factors, such as whether company directors have been buying shares.
How Growth Rates Impact P/E Ratios
When earnings fall, the 'E' decreases, over time. Therefore, even if you pay a low multiple of earnings now, that multiple will become higher in the future. A higher P/E should indicate the stock is expensive relative to others -- and that may encourage shareholders to sell.
National Australia Bank shrunk earnings per share by 17% over the last year. And it has shrunk its earnings per share by 3.5% per year over the last five years. This could justify a pessimistic P/E.
Remember: P/E Ratios Don't Consider The Balance Sheet
Don't forget that the P/E ratio considers market capitalization. That means it doesn't take debt or cash into account. The exact same company would hypothetically deserve a higher P/E ratio if it had a strong balance sheet, than if it had a weak one with lots of debt, because a cashed up company can spend on growth.
Such spending might be good or bad, overall, but the key point here is that you need to look at debt to understand the P/E ratio in context.
How Does National Australia Bank's Debt Impact Its P/E Ratio?
National Australia Bank has net debt worth a very significant 226% of its market capitalization. This is a relatively high level of debt, so the stock probably deserves a relatively low P/E ratio. Keep that in mind when comparing it to other companies.
The Verdict On National Australia Bank's P/E Ratio
National Australia Bank has a P/E of 10.3. That's below the average in the AU market, which is 14.9. Given meaningful debt, and a lack of recent growth, the market looks to be extrapolating this recent performance; reflecting low expectations for the future. What can be absolutely certain is that the market has become less optimistic about National Australia Bank over the last month, with the P/E ratio falling from 14.8 back then to 10.3 today. For those who prefer to invest with the flow of momentum, that might be a bad sign, but for a contrarian, it may signal opportunity.
Investors have an opportunity when market expectations about a stock are wrong. If the reality for a company is not as bad as the P/E ratio indicates, then the share price should increase as the market realizes this. So this free report on the analyst consensus forecasts could help you make a master move on this stock.
Of course, you might find a fantastic investment by looking at a few good candidates. So take a peek at this free list of companies with modest (or no) debt, trading on a P/E below 20.
If you spot an error that warrants correction, please contact the editor at editorial-team@simplywallst.com. This article by Simply Wall St is general in nature. It does not constitute a recommendation to buy or sell any stock, and does not take account of your objectives, or your financial situation. Simply Wall St has no position in the stocks mentioned.
We aim to bring you long-term focused research analysis driven by fundamental data. Note that our analysis may not factor in the latest price-sensitive company announcements or qualitative material. Thank you for reading.
