
 Yahoo Finance
 Does National Express Group PLC’s (LON:NEX) Debt Level Pose A Problem?

Small and large cap stocks are widely popular for a variety of reasons, however, mid-cap companies such as National Express Group PLC (LON:NEX), with a market cap of UK£2.0b, often get neglected by retail investors. Surprisingly though, when accounted for risk, mid-caps have delivered better returns compared to the two other categories of stocks. Let’s take a look at NEX’s debt concentration and assess their financial liquidity to get an idea of their ability to fund strategic acquisitions and grow through cyclical pressures. Remember this is a very top-level look that focuses exclusively on financial health, so I recommend a deeper analysis into NEX here.
Check out our latest analysis for National Express Group
Does NEX produce enough cash relative to debt?
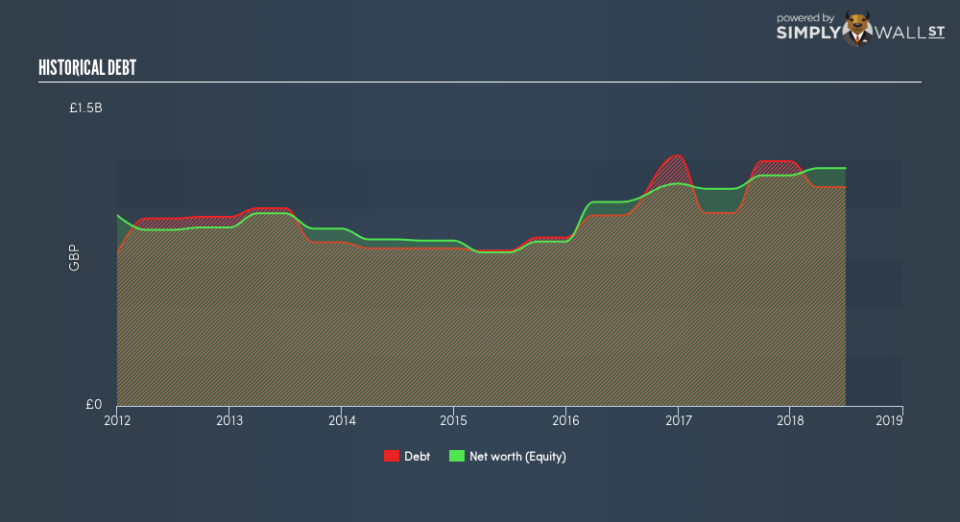
Over the past year, NEX has ramped up its debt from UK£976m to UK£1.1b , which includes long-term debt. With this growth in debt, NEX currently has UK£164m remaining in cash and short-term investments , ready to deploy into the business. Additionally, NEX has generated UK£293m in operating cash flow during the same period of time, resulting in an operating cash to total debt ratio of 27%, signalling that NEX’s current level of operating cash is high enough to cover debt. This ratio can also be interpreted as a measure of efficiency as an alternative to return on assets. In NEX’s case, it is able to generate 0.27x cash from its debt capital.
Does NEX’s liquid assets cover its short-term commitments?
At the current liabilities level of UK£951m, it seems that the business may not have an easy time meeting these commitments with a current assets level of UK£616m, leading to a current ratio of 0.65x.
Is NEX’s debt level acceptable?
With debt reaching 92% of equity, NEX may be thought of as relatively highly levered. This is not uncommon for a mid-cap company given that debt tends to be lower-cost and at times, more accessible. No matter how high the company’s debt, if it can easily cover the interest payments, it’s considered to be efficient with its use of excess leverage. A company generating earnings after interest and tax at least three times its net interest payments is considered financially sound. In NEX’s case, the ratio of 4.53x suggests that interest is appropriately covered, which means that lenders may be less hesitant to lend out more funding as NEX’s high interest coverage is seen as responsible and safe practice.
Next Steps:
Although NEX’s debt level is towards the higher end of the spectrum, its cash flow coverage seems adequate to meet debt obligations which means its debt is being efficiently utilised. But, its lack of liquidity raises questions over current asset management practices for the mid-cap. Keep in mind I haven’t considered other factors such as how NEX has been performing in the past. I recommend you continue to research National Express Group to get a more holistic view of the stock by looking at:
Future Outlook: What are well-informed industry analysts predicting for NEX’s future growth? Take a look at our free research report of analyst consensus for NEX’s outlook.
Valuation: What is NEX worth today? Is the stock undervalued, even when its growth outlook is factored into its intrinsic value? The intrinsic value infographic in our free research report helps visualize whether NEX is currently mispriced by the market.
Other High-Performing Stocks: Are there other stocks that provide better prospects with proven track records? Explore our free list of these great stocks here.
To help readers see past the short term volatility of the financial market, we aim to bring you a long-term focused research analysis purely driven by fundamental data. Note that our analysis does not factor in the latest price-sensitive company announcements.
The author is an independent contributor and at the time of publication had no position in the stocks mentioned. For errors that warrant correction please contact the editor at editorial-team@simplywallst.com.
