
 Yahoo Finance
 Does National Express Group PLC’s (LON:NEX) CEO Pay Reflect Performance?

Dean Finch has been the CEO of National Express Group PLC (LON:NEX) since 2010. This report will, first, examine the CEO compensation levels in comparison to CEO compensation at companies of similar size. Next, we’ll consider growth that the business demonstrates. Third, we’ll reflect on the total return to shareholders over three years, as a second measure of business performance. This method should give us information to assess how appropriately the company pays the CEO.
Check out our latest analysis for National Express Group
How Does Dean Finch’s Compensation Compare With Similar Sized Companies?
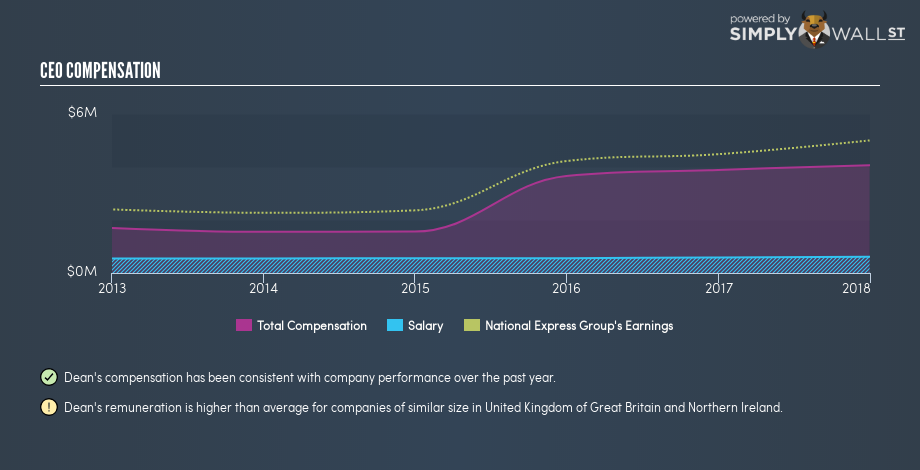
According to our data, National Express Group PLC has a market capitalization of UK£1.9b, and pays its CEO total annual compensation worth UK£4.1m. (This figure is for the year to 2017). While we always look at total compensation first, we note that the salary component is less, at UK£615k. We looked at a group of companies with market capitalizations from UK£1.6b to UK£5.0b, and the median CEO compensation was UK£2.1m.
Thus we can conclude that Dean Finch receives more in total compensation than the median of a group of companies in the same market, and of similar size to National Express Group PLC. However, this doesn’t necessarily mean the pay is too high. We can get a better idea of how generous the pay is by looking at the performance of the underlying business.
You can see a visual representation of the CEO compensation at National Express Group, below.
Is National Express Group PLC Growing?
Over the last three years National Express Group PLC has grown its earnings per share (EPS) by an average of 13% per year. It achieved revenue growth of 4.5% over the last year.
This demonstrates that the company has been improving recently. A good result. It’s also good to see modest revenue growth, suggesting the underlying business is healthy.
Shareholders might be interested in this free visualization of analyst forecasts. .
Has National Express Group PLC Been A Good Investment?
National Express Group PLC has generated a total shareholder return of 33% over three years, so most shareholders would be reasonably content. But they would probably prefer not to see CEO compensation far in excess of the median.
In Summary…
We compared the total CEO remuneration paid by National Express Group PLC, and compared it to remuneration at a group of similar sized companies. As discussed above, we discovered that the company pays more than the median of that group.
Importantly, though, the company has impressed with its earnings per share growth, over three years. Looking at the same time period, we think that the shareholder returns are respectable. You might wish to research management further, but on this analysis, considering the EPS growth, we wouldn’t call the CEO pay problematic. CEO compensation is one thing, but it is also interesting to check if the CEO is buying or selling National Express Group (free visualization of insider trades).
Or you might rather take a peek at this analytical visualization of historic cash flow, earnings and revenue.
To help readers see past the short term volatility of the financial market, we aim to bring you a long-term focused research analysis purely driven by fundamental data. Note that our analysis does not factor in the latest price-sensitive company announcements.
The author is an independent contributor and at the time of publication had no position in the stocks mentioned. For errors that warrant correction please contact the editor at editorial-team@simplywallst.com.
