
 Yahoo Finance
 How Does Neways Electronics International's (AMS:NEWAY) P/E Compare To Its Industry, After The Share Price Drop?

Unfortunately for some shareholders, the Neways Electronics International (AMS:NEWAY) share price has dived 44% in the last thirty days. Given the 60% drop over the last year, some shareholders might be worried that they have become bagholders. For those wondering, a bagholder is someone who keeps holding a losing stock indefinitely, without taking the time to consider its prospects carefully, going forward.
All else being equal, a share price drop should make a stock more attractive to potential investors. In the long term, share prices tend to follow earnings per share, but in the short term prices bounce around in response to short term factors (which are not always obvious). The implication here is that long term investors have an opportunity when expectations of a company are too low. One way to gauge market expectations of a stock is to look at its Price to Earnings Ratio (PE Ratio). Investors have optimistic expectations of companies with higher P/E ratios, compared to companies with lower P/E ratios.
Check out our latest analysis for Neways Electronics International
Does Neways Electronics International Have A Relatively High Or Low P/E For Its Industry?
We can tell from its P/E ratio of 7.16 that sentiment around Neways Electronics International isn't particularly high. We can see in the image below that the average P/E (13.6) for companies in the electronic industry is higher than Neways Electronics International's P/E.
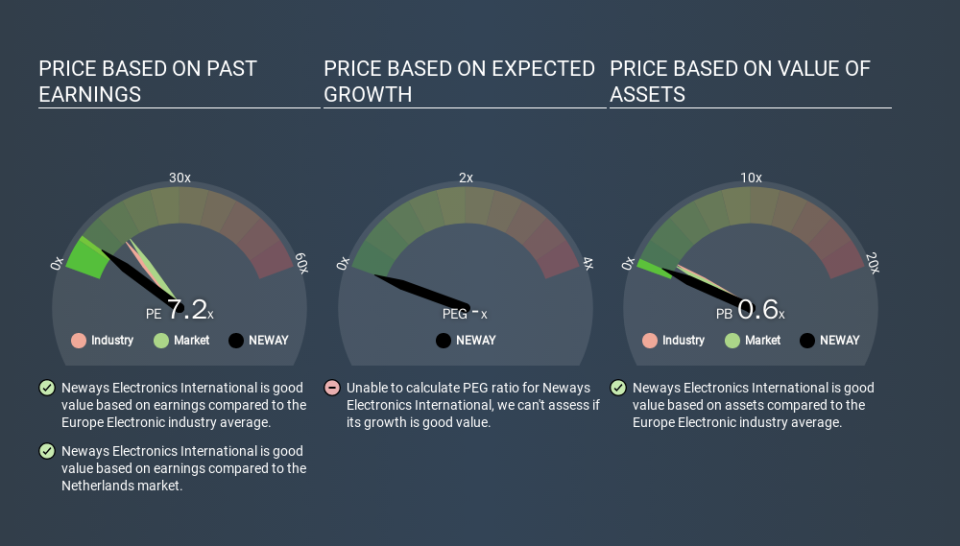
Its relatively low P/E ratio indicates that Neways Electronics International shareholders think it will struggle to do as well as other companies in its industry classification. Many investors like to buy stocks when the market is pessimistic about their prospects. If you consider the stock interesting, further research is recommended. For example, I often monitor director buying and selling.
How Growth Rates Impact P/E Ratios
When earnings fall, the 'E' decreases, over time. Therefore, even if you pay a low multiple of earnings now, that multiple will become higher in the future. Then, a higher P/E might scare off shareholders, pushing the share price down.
Neways Electronics International shrunk earnings per share by 42% over the last year. But EPS is up 1.3% over the last 5 years. And over the longer term (3 years) earnings per share have decreased 6.0% annually. This growth rate might warrant a low P/E ratio.
A Limitation: P/E Ratios Ignore Debt and Cash In The Bank
One drawback of using a P/E ratio is that it considers market capitalization, but not the balance sheet. In other words, it does not consider any debt or cash that the company may have on the balance sheet. In theory, a company can lower its future P/E ratio by using cash or debt to invest in growth.
While growth expenditure doesn't always pay off, the point is that it is a good option to have; but one that the P/E ratio ignores.
Is Debt Impacting Neways Electronics International's P/E?
Neways Electronics International has net debt worth 56% of its market capitalization. This is enough debt that you'd have to make some adjustments before using the P/E ratio to compare it to a company with net cash.
The Verdict On Neways Electronics International's P/E Ratio
Neways Electronics International has a P/E of 7.2. That's below the average in the NL market, which is 14.7. When you consider that the company has significant debt, and didn't grow EPS last year, it isn't surprising that the market has muted expectations. Given Neways Electronics International's P/E ratio has declined from 12.8 to 7.2 in the last month, we know for sure that the market is more worried about the business today, than it was back then. For those who prefer invest in growth, this stock apparently offers limited promise, but the deep value investors may find the pessimism around this stock enticing.
Investors should be looking to buy stocks that the market is wrong about. As value investor Benjamin Graham famously said, 'In the short run, the market is a voting machine but in the long run, it is a weighing machine. We don't have analyst forecasts, but shareholders might want to examine this detailed historical graph of earnings, revenue and cash flow.
But note: Neways Electronics International may not be the best stock to buy. So take a peek at this free list of interesting companies with strong recent earnings growth (and a P/E ratio below 20).
If you spot an error that warrants correction, please contact the editor at editorial-team@simplywallst.com. This article by Simply Wall St is general in nature. It does not constitute a recommendation to buy or sell any stock, and does not take account of your objectives, or your financial situation. Simply Wall St has no position in the stocks mentioned.
We aim to bring you long-term focused research analysis driven by fundamental data. Note that our analysis may not factor in the latest price-sensitive company announcements or qualitative material. Thank you for reading.
