
 Yahoo Finance
 Does NIBE Industrier AB (publ) (STO:NIBE B) Create Value For Shareholders?

Today we are going to look at NIBE Industrier AB (publ) (STO:NIBE B) to see whether it might be an attractive investment prospect. Specifically, we'll consider its Return On Capital Employed (ROCE), since that will give us an insight into how efficiently the business can generate profits from the capital it requires.
First of all, we'll work out how to calculate ROCE. Second, we'll look at its ROCE compared to similar companies. And finally, we'll look at how its current liabilities are impacting its ROCE.
Return On Capital Employed (ROCE): What is it?
ROCE is a metric for evaluating how much pre-tax income (in percentage terms) a company earns on the capital invested in its business. Generally speaking a higher ROCE is better. In brief, it is a useful tool, but it is not without drawbacks. Author Edwin Whiting says to be careful when comparing the ROCE of different businesses, since 'No two businesses are exactly alike.
So, How Do We Calculate ROCE?
Analysts use this formula to calculate return on capital employed:
Return on Capital Employed = Earnings Before Interest and Tax (EBIT) ÷ (Total Assets - Current Liabilities)
Or for NIBE Industrier:
0.097 = kr2.8b ÷ (kr36b - kr6.9b) (Based on the trailing twelve months to June 2019.)
Therefore, NIBE Industrier has an ROCE of 9.7%.
Check out our latest analysis for NIBE Industrier
Is NIBE Industrier's ROCE Good?
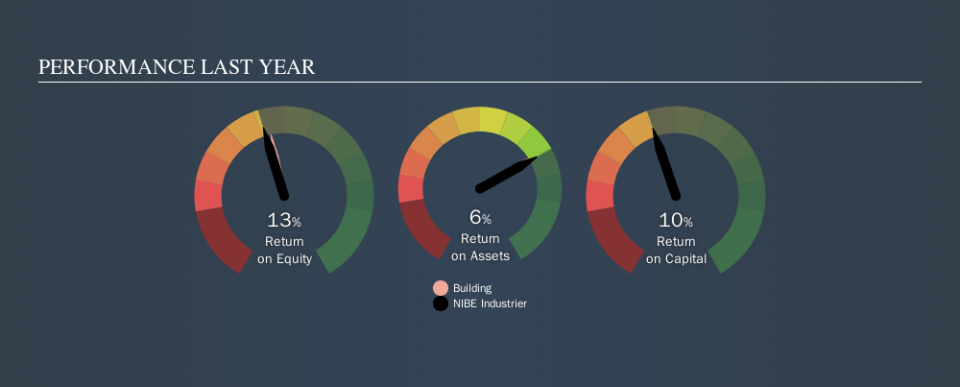
One way to assess ROCE is to compare similar companies. Using our data, NIBE Industrier's ROCE appears to be around the 12% average of the Building industry. Independently of how NIBE Industrier compares to its industry, its ROCE in absolute terms appears decent, and the company may be worthy of closer investigation.
You can see in the image below how NIBE Industrier's ROCE compares to its industry. Click to see more on past growth.
Remember that this metric is backwards looking - it shows what has happened in the past, and does not accurately predict the future. ROCE can be deceptive for cyclical businesses, as returns can look incredible in boom times, and terribly low in downturns. ROCE is only a point-in-time measure. Since the future is so important for investors, you should check out our free report on analyst forecasts for NIBE Industrier.
What Are Current Liabilities, And How Do They Affect NIBE Industrier's ROCE?
Current liabilities are short term bills and invoices that need to be paid in 12 months or less. The ROCE equation subtracts current liabilities from capital employed, so a company with a lot of current liabilities appears to have less capital employed, and a higher ROCE than otherwise. To counteract this, we check if a company has high current liabilities, relative to its total assets.
NIBE Industrier has total assets of kr36b and current liabilities of kr6.9b. Therefore its current liabilities are equivalent to approximately 19% of its total assets. Low current liabilities are not boosting the ROCE too much.
What We Can Learn From NIBE Industrier's ROCE
Overall, NIBE Industrier has a decent ROCE and could be worthy of further research. NIBE Industrier shapes up well under this analysis, but it is far from the only business delivering excellent numbers . You might also want to check this free collection of companies delivering excellent earnings growth.
For those who like to find winning investments this free list of growing companies with recent insider purchasing, could be just the ticket.
We aim to bring you long-term focused research analysis driven by fundamental data. Note that our analysis may not factor in the latest price-sensitive company announcements or qualitative material.
If you spot an error that warrants correction, please contact the editor at editorial-team@simplywallst.com. This article by Simply Wall St is general in nature. It does not constitute a recommendation to buy or sell any stock, and does not take account of your objectives, or your financial situation. Simply Wall St has no position in the stocks mentioned. Thank you for reading.
