
 Yahoo Finance
 Does NIBE Industrier (STO:NIBE B) Have A Healthy Balance Sheet?

Some say volatility, rather than debt, is the best way to think about risk as an investor, but Warren Buffett famously said that 'Volatility is far from synonymous with risk.' When we think about how risky a company is, we always like to look at its use of debt, since debt overload can lead to ruin. As with many other companies NIBE Industrier AB (publ) (STO:NIBE B) makes use of debt. But is this debt a concern to shareholders?
Why Does Debt Bring Risk?
Debt assists a business until the business has trouble paying it off, either with new capital or with free cash flow. In the worst case scenario, a company can go bankrupt if it cannot pay its creditors. However, a more usual (but still expensive) situation is where a company must dilute shareholders at a cheap share price simply to get debt under control. Of course, the upside of debt is that it often represents cheap capital, especially when it replaces dilution in a company with the ability to reinvest at high rates of return. The first step when considering a company's debt levels is to consider its cash and debt together.
View our latest analysis for NIBE Industrier
How Much Debt Does NIBE Industrier Carry?
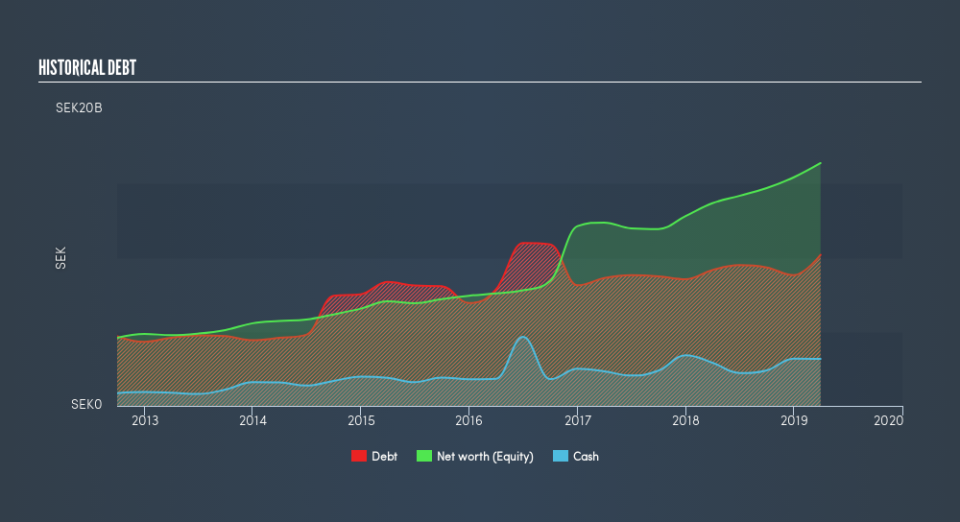
You can click the graphic below for the historical numbers, but it shows that as of March 2019 NIBE Industrier had kr10.2b of debt, an increase on kr9.16b, over one year. However, it also had kr3.17b in cash, and so its net debt is kr7.02b.
How Strong Is NIBE Industrier's Balance Sheet?
Zooming in on the latest balance sheet data, we can see that NIBE Industrier had liabilities of kr6.19b due within 12 months and liabilities of kr12.2b due beyond that. Offsetting these obligations, it had cash of kr3.17b as well as receivables valued at kr4.16b due within 12 months. So it has liabilities totalling kr11.0b more than its cash and near-term receivables, combined.
Given NIBE Industrier has a market capitalization of kr67.9b, it's hard to believe these liabilities pose much threat. However, we do think it is worth keeping an eye on its balance sheet strength, as it may change over time.
We use two main ratios to inform us about debt levels relative to earnings. The first is net debt divided by earnings before interest, tax, depreciation, and amortization (EBITDA), while the second is how many times its earnings before interest and tax (EBIT) covers its interest expense (or its interest cover, for short). Thus we consider debt relative to earnings both with and without depreciation and amortization expenses.
We'd say that NIBE Industrier's moderate net debt to EBITDA ratio ( being 2.0), indicates prudence when it comes to debt. And its strong interest cover of 20.8 times, makes us even more comfortable. If NIBE Industrier can keep growing EBIT at last year's rate of 20% over the last year, then it will find its debt load easier to manage. The balance sheet is clearly the area to focus on when you are analysing debt. But ultimately the future profitability of the business will decide if NIBE Industrier can strengthen its balance sheet over time. So if you want to see what the professionals think, you might find this free report on analyst profit forecasts to be interesting.
Finally, while the tax-man may adore accounting profits, lenders only accept cold hard cash. So we always check how much of that EBIT is translated into free cash flow. During the last three years, NIBE Industrier produced sturdy free cash flow equating to 59% of its EBIT, about what we'd expect. This cold hard cash means it can reduce its debt when it wants to.
Our View
NIBE Industrier's interest cover suggests it can handle its debt as easily as Cristiano Ronaldo could score a goal against an under 14's goalkeeper. And the good news does not stop there, as its EBIT growth rate also supports that impression! When we consider the range of factors above, it looks like NIBE Industrier is pretty sensible with its use of debt. While that brings some risk, it can also enhance returns for shareholders. Over time, share prices tend to follow earnings per share, so if you're interested in NIBE Industrier, you may well want to click here to check an interactive graph of its earnings per share history.
At the end of the day, it's often better to focus on companies that are free from net debt. You can access our special list of such companies (all with a track record of profit growth). It's free.
We aim to bring you long-term focused research analysis driven by fundamental data. Note that our analysis may not factor in the latest price-sensitive company announcements or qualitative material.
If you spot an error that warrants correction, please contact the editor at editorial-team@simplywallst.com. This article by Simply Wall St is general in nature. It does not constitute a recommendation to buy or sell any stock, and does not take account of your objectives, or your financial situation. Simply Wall St has no position in the stocks mentioned. Thank you for reading.
