
 Yahoo Finance
 What Does Nokian Renkaat Oyj's (HEL:NRE1V) P/E Ratio Tell You?

Want to participate in a research study? Help shape the future of investing tools and earn a $60 gift card!
This article is for investors who would like to improve their understanding of price to earnings ratios (P/E ratios). We'll look at Nokian Renkaat Oyj's (HEL:NRE1V) P/E ratio and reflect on what it tells us about the company's share price. Nokian Renkaat Oyj has a P/E ratio of 14.03, based on the last twelve months. That means that at current prices, buyers pay €14.03 for every €1 in trailing yearly profits.
View our latest analysis for Nokian Renkaat Oyj
How Do You Calculate A P/E Ratio?
The formula for price to earnings is:
Price to Earnings Ratio = Price per Share ÷ Earnings per Share (EPS)
Or for Nokian Renkaat Oyj:
P/E of 14.03 = €30.17 ÷ €2.15 (Based on the trailing twelve months to December 2018.)
Is A High P/E Ratio Good?
A higher P/E ratio implies that investors pay a higher price for the earning power of the business. All else being equal, it's better to pay a low price -- but as Warren Buffett said, 'It's far better to buy a wonderful company at a fair price than a fair company at a wonderful price.'
How Growth Rates Impact P/E Ratios
P/E ratios primarily reflect market expectations around earnings growth rates. When earnings grow, the 'E' increases, over time. That means unless the share price increases, the P/E will reduce in a few years. So while a stock may look expensive based on past earnings, it could be cheap based on future earnings.
It's nice to see that Nokian Renkaat Oyj grew EPS by a stonking 32% in the last year. And earnings per share have improved by 6.7% annually, over the last five years. I'd therefore be a little surprised if its P/E ratio was not relatively high.
How Does Nokian Renkaat Oyj's P/E Ratio Compare To Its Peers?
We can get an indication of market expectations by looking at the P/E ratio. The image below shows that Nokian Renkaat Oyj has a higher P/E than the average (11.5) P/E for companies in the auto components industry.
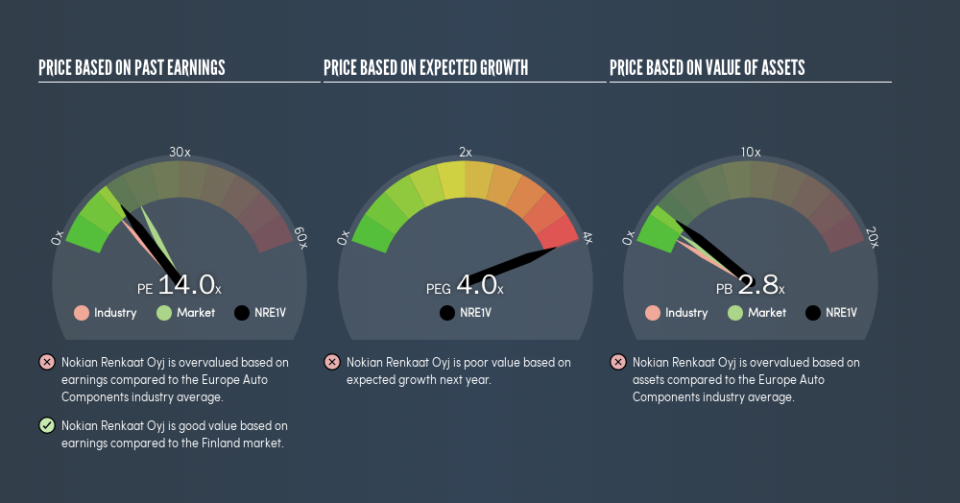
That means that the market expects Nokian Renkaat Oyj will outperform other companies in its industry. Clearly the market expects growth, but it isn't guaranteed. So investors should delve deeper. I like to check if company insiders have been buying or selling.
Don't Forget: The P/E Does Not Account For Debt or Bank Deposits
It's important to note that the P/E ratio considers the market capitalization, not the enterprise value. In other words, it does not consider any debt or cash that the company may have on the balance sheet. Theoretically, a business can improve its earnings (and produce a lower P/E in the future), by taking on debt (or spending its remaining cash).
Spending on growth might be good or bad a few years later, but the point is that the P/E ratio does not account for the option (or lack thereof).
Is Debt Impacting Nokian Renkaat Oyj's P/E?
Since Nokian Renkaat Oyj holds net cash of €315m, it can spend on growth, justifying a higher P/E ratio than otherwise.
The Bottom Line On Nokian Renkaat Oyj's P/E Ratio
Nokian Renkaat Oyj has a P/E of 14. That's below the average in the FI market, which is 18.6. It grew its EPS nicely over the last year, and the healthy balance sheet implies there is more potential for growth. The below average P/E ratio suggests that market participants don't believe the strong growth will continue.
Investors should be looking to buy stocks that the market is wrong about. As value investor Benjamin Graham famously said, 'In the short run, the market is a voting machine but in the long run, it is a weighing machine.' So this free report on the analyst consensus forecasts could help you make a master move on this stock.
Of course you might be able to find a better stock than Nokian Renkaat Oyj. So you may wish to see this free collection of other companies that have grown earnings strongly.
We aim to bring you long-term focused research analysis driven by fundamental data. Note that our analysis may not factor in the latest price-sensitive company announcements or qualitative material.
If you spot an error that warrants correction, please contact the editor at editorial-team@simplywallst.com. This article by Simply Wall St is general in nature. It does not constitute a recommendation to buy or sell any stock, and does not take account of your objectives, or your financial situation. Simply Wall St has no position in the stocks mentioned. Thank you for reading.
