
 Yahoo Finance
 Does NV Bekaert SA’s (EBR:BEKB) ROCE Reflect Well On The Business?
Today we are going to look at NV Bekaert SA (EBR:BEKB) to see whether it might be an attractive investment prospect. Specifically, we'll consider its Return On Capital Employed (ROCE), since that will give us an insight into how efficiently the business can generate profits from the capital it requires.
Firstly, we'll go over how we calculate ROCE. Second, we'll look at its ROCE compared to similar companies. Last but not least, we'll look at what impact its current liabilities have on its ROCE.
Understanding Return On Capital Employed (ROCE)
ROCE is a metric for evaluating how much pre-tax income (in percentage terms) a company earns on the capital invested in its business. All else being equal, a better business will have a higher ROCE. Overall, it is a valuable metric that has its flaws. Author Edwin Whiting says to be careful when comparing the ROCE of different businesses, since 'No two businesses are exactly alike.
So, How Do We Calculate ROCE?
The formula for calculating the return on capital employed is:
Return on Capital Employed = Earnings Before Interest and Tax (EBIT) ÷ (Total Assets - Current Liabilities)
Or for NV Bekaert:
0.08 = €226m ÷ (€4.5b - €1.6b) (Based on the trailing twelve months to June 2019.)
So, NV Bekaert has an ROCE of 8.0%.
See our latest analysis for NV Bekaert
Does NV Bekaert Have A Good ROCE?
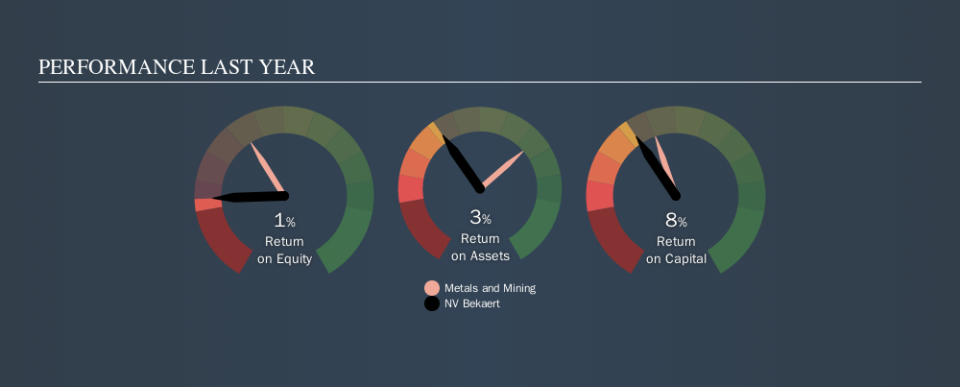
ROCE can be useful when making comparisons, such as between similar companies. It appears that NV Bekaert's ROCE is fairly close to the Metals and Mining industry average of 9.1%. Separate from how NV Bekaert stacks up against its industry, its ROCE in absolute terms is mediocre; relative to the returns on government bonds. Readers may find more attractive investment prospects elsewhere.
You can see in the image below how NV Bekaert's ROCE compares to its industry. Click to see more on past growth.
When considering ROCE, bear in mind that it reflects the past and does not necessarily predict the future. ROCE can be deceptive for cyclical businesses, as returns can look incredible in boom times, and terribly low in downturns. ROCE is only a point-in-time measure. Given the industry it operates in, NV Bekaert could be considered cyclical. Future performance is what matters, and you can see analyst predictions in our free report on analyst forecasts for the company.
How NV Bekaert's Current Liabilities Impact Its ROCE
Short term (or current) liabilities, are things like supplier invoices, overdrafts, or tax bills that need to be paid within 12 months. Due to the way ROCE is calculated, a high level of current liabilities makes a company look as though it has less capital employed, and thus can (sometimes unfairly) boost the ROCE. To counter this, investors can check if a company has high current liabilities relative to total assets.
NV Bekaert has total assets of €4.5b and current liabilities of €1.6b. As a result, its current liabilities are equal to approximately 36% of its total assets. NV Bekaert has a medium level of current liabilities, which would boost its ROCE somewhat.
What We Can Learn From NV Bekaert's ROCE
With this level of liabilities and a mediocre ROCE, there are potentially better investments out there. You might be able to find a better investment than NV Bekaert. If you want a selection of possible winners, check out this free list of interesting companies that trade on a P/E below 20 (but have proven they can grow earnings).
If you are like me, then you will not want to miss this free list of growing companies that insiders are buying.
We aim to bring you long-term focused research analysis driven by fundamental data. Note that our analysis may not factor in the latest price-sensitive company announcements or qualitative material.
If you spot an error that warrants correction, please contact the editor at editorial-team@simplywallst.com. This article by Simply Wall St is general in nature. It does not constitute a recommendation to buy or sell any stock, and does not take account of your objectives, or your financial situation. Simply Wall St has no position in the stocks mentioned. Thank you for reading.
