
 Yahoo Finance
 What Does Oxford Metrics plc's (LON:OMG) Share Price Indicate?
Oxford Metrics plc (LON:OMG), is not the largest company out there, but it received a lot of attention from a substantial price movement on the AIM over the last few months, increasing to UK£1.11 at one point, and dropping to the lows of UK£0.96. Some share price movements can give investors a better opportunity to enter into the stock, and potentially buy at a lower price. A question to answer is whether Oxford Metrics' current trading price of UK£1.02 reflective of the actual value of the small-cap? Or is it currently undervalued, providing us with the opportunity to buy? Let’s take a look at Oxford Metrics’s outlook and value based on the most recent financial data to see if there are any catalysts for a price change.
See our latest analysis for Oxford Metrics
What's The Opportunity In Oxford Metrics?
Oxford Metrics is currently expensive based on my price multiple model, where I look at the company's price-to-earnings ratio in comparison to the industry average. I’ve used the price-to-earnings ratio in this instance because there’s not enough visibility to forecast its cash flows. The stock’s ratio of 38.9x is currently well-above the industry average of 32.53x, meaning that it is trading at a more expensive price relative to its peers. Another thing to keep in mind is that Oxford Metrics’s share price is quite stable relative to the rest of the market, as indicated by its low beta. This means that if you believe the current share price should move towards the levels of its industry peers over time, a low beta could suggest it is not likely to reach that level anytime soon, and once it’s there, it may be hard for it to fall back down into an attractive buying range again.
What does the future of Oxford Metrics look like?
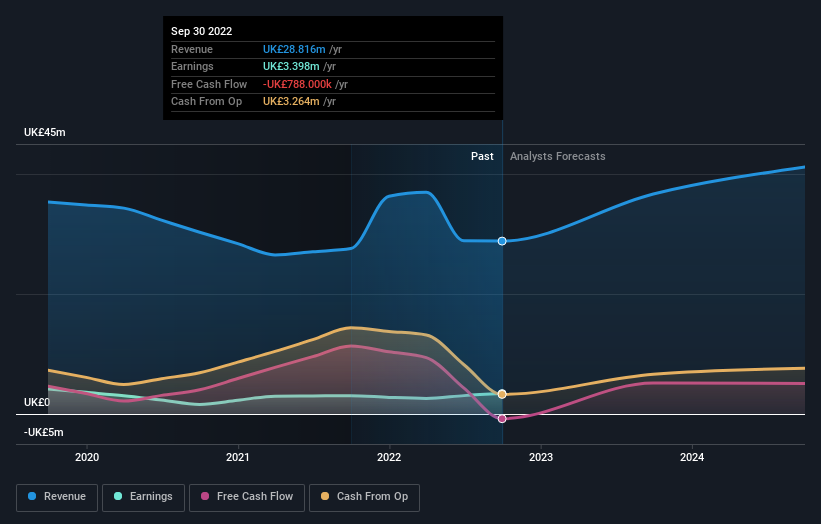
Future outlook is an important aspect when you’re looking at buying a stock, especially if you are an investor looking for growth in your portfolio. Although value investors would argue that it’s the intrinsic value relative to the price that matter the most, a more compelling investment thesis would be high growth potential at a cheap price. With revenues expected to grow by 91% over the next couple of years, the future seems bright for Oxford Metrics. If the level of expenses is able to be maintained, it looks like higher cash flow is on the cards for the stock, which should feed into a higher share valuation.
What This Means For You
Are you a shareholder? OMG’s optimistic future growth appears to have been factored into the current share price, with shares trading above industry price multiples. At this current price, shareholders may be asking a different question – should I sell? If you believe OMG should trade below its current price, selling high and buying it back up again when its price falls towards the industry PE ratio can be profitable. But before you make this decision, take a look at whether its fundamentals have changed.
Are you a potential investor? If you’ve been keeping an eye on OMG for a while, now may not be the best time to enter into the stock. The price has surpassed its industry peers, which means it is likely that there is no more upside from mispricing. However, the positive outlook is encouraging for OMG, which means it’s worth diving deeper into other factors in order to take advantage of the next price drop.
Keep in mind, when it comes to analysing a stock it's worth noting the risks involved. Every company has risks, and we've spotted 5 warning signs for Oxford Metrics (of which 3 make us uncomfortable!) you should know about.
If you are no longer interested in Oxford Metrics, you can use our free platform to see our list of over 50 other stocks with a high growth potential.
Have feedback on this article? Concerned about the content? Get in touch with us directly. Alternatively, email editorial-team (at) simplywallst.com.
This article by Simply Wall St is general in nature. We provide commentary based on historical data and analyst forecasts only using an unbiased methodology and our articles are not intended to be financial advice. It does not constitute a recommendation to buy or sell any stock, and does not take account of your objectives, or your financial situation. We aim to bring you long-term focused analysis driven by fundamental data. Note that our analysis may not factor in the latest price-sensitive company announcements or qualitative material. Simply Wall St has no position in any stocks mentioned.
Join A Paid User Research Session
You’ll receive a US$30 Amazon Gift card for 1 hour of your time while helping us build better investing tools for the individual investors like yourself. Sign up here
