
 Yahoo Finance
 Does Persimmon Plc’s (LON:PSN) Recent Track Record Look Strong?

When Persimmon Plc (LON:PSN) announced its most recent earnings (31 December 2017), I did two things: looked at its past earnings track record, then look at what is happening in the industry. Understanding how Persimmon performed requires a benchmark rather than trying to assess a standalone number at one point in time. Below is a quick commentary on how I see PSN has performed. See our latest analysis for Persimmon
How PSN fared against its long-term earnings performance and its industry
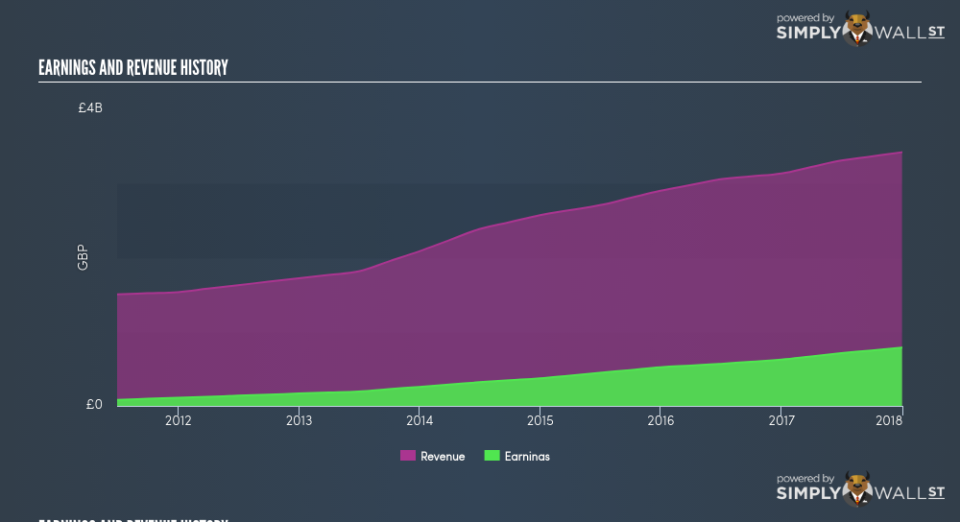
PSN’s trailing twelve-month earnings (from 31 December 2017) of UK£786.90m has jumped 25.84% compared to the previous year. However, this one-year growth rate has been lower than its average earnings growth rate over the past 5 years of 29.56%, indicating the rate at which PSN is growing has slowed down. To understand what’s happening, let’s look at what’s transpiring with margins and if the entire industry is feeling the heat.
In the past couple of years, revenue growth has been lagging behind which implies that Persimmon’s bottom line has been driven by unsustainable cost-reductions. Eyeballing growth from a sector-level, the UK consumer durables industry has been growing its average earnings by double-digit 19.67% in the previous year, and 24.04% over the past half a decade. This means any tailwind the industry is profiting from, Persimmon is capable of amplifying this to its advantage.
In terms of returns from investment, Persimmon has invested its equity funds well leading to a 24.58% return on equity (ROE), above the sensible minimum of 20%. Furthermore, its return on assets (ROA) of 16.33% exceeds the GB Consumer Durables industry of 10.63%, indicating Persimmon has used its assets more efficiently. And finally, its return on capital (ROC), which also accounts for Persimmon’s debt level, has increased over the past 3 years from 18.42% to 26.98%.
What does this mean?
Though Persimmon’s past data is helpful, it is only one aspect of my investment thesis. Companies that have performed well in the past, such as Persimmon gives investors conviction. However, the next step would be to assess whether the future looks as optimistic. I recommend you continue to research Persimmon to get a better picture of the stock by looking at:
Future Outlook: What are well-informed industry analysts predicting for PSN’s future growth? Take a look at our free research report of analyst consensus for PSN’s outlook.
Financial Health: Is PSN’s operations financially sustainable? Balance sheets can be hard to analyze, which is why we’ve done it for you. Check out our financial health checks here.
Other High-Performing Stocks: Are there other stocks that provide better prospects with proven track records? Explore our free list of these great stocks here.
NB: Figures in this article are calculated using data from the trailing twelve months from 31 December 2017. This may not be consistent with full year annual report figures.
To help readers see pass the short term volatility of the financial market, we aim to bring you a long-term focused research analysis purely driven by fundamental data. Note that our analysis does not factor in the latest price sensitive company announcements.
The author is an independent contributor and at the time of publication had no position in the stocks mentioned.
