
 Yahoo Finance
 How Does Prada S.p.A.'s (HKG:1913) Earnings Growth Stack Up Against Industry Performance?

For investors, increase in profitability and industry-beating performance can be essential considerations in an investment. Below, I will examine Prada S.p.A.'s (SEHK:1913) track record on a high level, to give you some insight into how the company has been performing against its long term trend and its industry peers.
Check out our latest analysis for Prada
Were 1913's earnings stronger than its past performances and the industry?
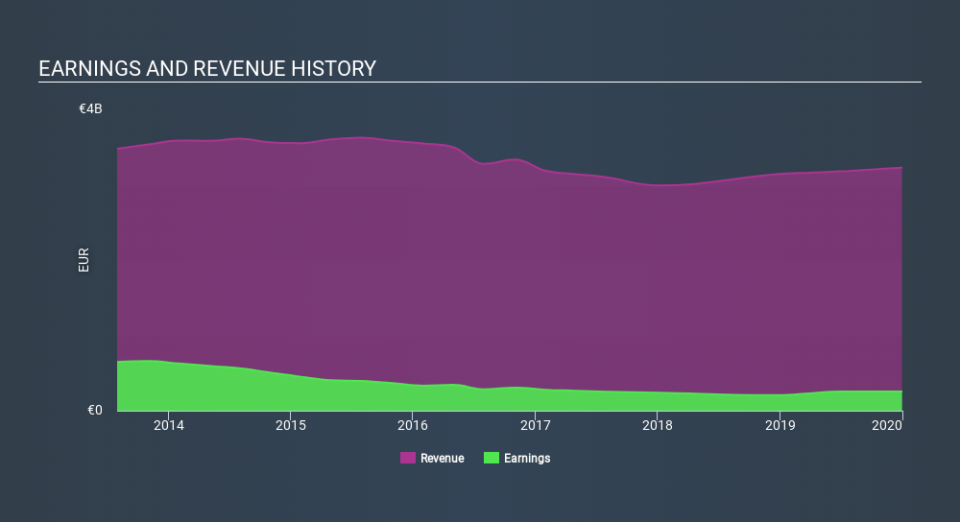
1913's trailing twelve-month earnings (from 31 December 2019) of €256m has jumped 25% compared to the previous year.
Furthermore, this one-year growth rate has exceeded its 5-year annual growth average of -12%, indicating the rate at which 1913 is growing has accelerated. What's the driver of this growth? Well, let’s take a look at if it is merely owing to industry tailwinds, or if Prada has experienced some company-specific growth.
In terms of returns from investment, Prada has fallen short of achieving a 20% return on equity (ROE), recording 8.6% instead. Furthermore, its return on assets (ROA) of 4.4% is below the HK Luxury industry of 5.6%, indicating Prada's are utilized less efficiently. And finally, its return on capital (ROC), which also accounts for Prada’s debt level, has declined over the past 3 years from 11% to 5.3%. This correlates with an increase in debt holding, with debt-to-equity ratio rising from 17% to 28% over the past 5 years.
What does this mean?
Prada's track record can be a valuable insight into its earnings performance, but it certainly doesn't tell the whole story. Recent positive growth doesn’t necessarily mean it’s onwards and upwards for the company. I recommend you continue to research Prada to get a better picture of the stock by looking at:
Future Outlook: What are well-informed industry analysts predicting for 1913’s future growth? Take a look at our free research report of analyst consensus for 1913’s outlook.
Financial Health: Are 1913’s operations financially sustainable? Balance sheets can be hard to analyze, which is why we’ve done it for you. Check out our financial health checks here.
Other High-Performing Stocks: Are there other stocks that provide better prospects with proven track records? Explore our free list of these great stocks here.
NB: Figures in this article are calculated using data from the trailing twelve months from 31 December 2019. This may not be consistent with full year annual report figures.
Love or hate this article? Concerned about the content? Get in touch with us directly. Alternatively, email editorial-team@simplywallst.com.
This article by Simply Wall St is general in nature. It does not constitute a recommendation to buy or sell any stock, and does not take account of your objectives, or your financial situation. We aim to bring you long-term focused analysis driven by fundamental data. Note that our analysis may not factor in the latest price-sensitive company announcements or qualitative material. Simply Wall St has no position in any stocks mentioned. Thank you for reading.
