
 Yahoo Finance
 What does PZ Cussons Plc’s (LON:PZC) Balance Sheet Tell Us About Its Future?

While small-cap stocks, such as PZ Cussons Plc (LON:PZC) with its market cap of UK£878m, are popular for their explosive growth, investors should also be aware of their balance sheet to judge whether the company can survive a downturn. So, understanding the company’s financial health becomes vital, as mismanagement of capital can lead to bankruptcies, which occur at a higher rate for small-caps. Here are few basic financial health checks you should consider before taking the plunge. Nevertheless, this commentary is still very high-level, so I suggest you dig deeper yourself into PZC here.
How much cash does PZC generate through its operations?
Over the past year, PZC has reduced its debt from UK£295m to UK£268m made up of predominantly near term debt. With this debt repayment, the current cash and short-term investment levels stands at UK£103m for investing into the business. Moreover, PZC has generated UK£35m in operating cash flow during the same period of time, leading to an operating cash to total debt ratio of 13%, signalling that PZC’s operating cash is not sufficient to cover its debt. This ratio can also be a sign of operational efficiency as an alternative to return on assets. In PZC’s case, it is able to generate 0.13x cash from its debt capital.
Does PZC’s liquid assets cover its short-term commitments?
Looking at PZC’s UK£471m in current liabilities, the company arguably has a rather low level of current assets relative its obligations, with the current ratio last standing at 0.85x.
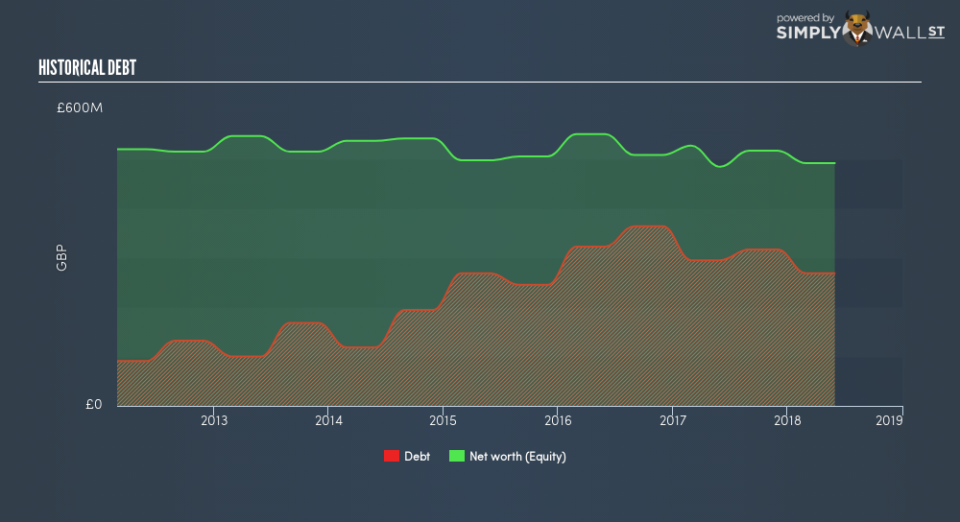
Can PZC service its debt comfortably?
With a debt-to-equity ratio of 55%, PZC can be considered as an above-average leveraged company. This is not unusual for small-caps as debt tends to be a cheaper and faster source of funding for some businesses. We can check to see whether PZC is able to meet its debt obligations by looking at the net interest coverage ratio. A company generating earnings before interest and tax (EBIT) at least three times its net interest payments is considered financially sound. In PZC’s, case, the ratio of 15.05x suggests that interest is comfortably covered, which means that lenders may be less hesitant to lend out more funding as PZC’s high interest coverage is seen as responsible and safe practice.
Next Steps:
PZC’s high cash coverage means that, although its debt levels are high, the company is able to utilise its borrowings efficiently in order to generate cash flow. But, its low liquidity raises concerns over whether current asset management practices are properly implemented for the small-cap. I admit this is a fairly basic analysis for PZC’s financial health. Other important fundamentals need to be considered alongside. I recommend you continue to research PZ Cussons to get a better picture of the stock by looking at:
Future Outlook: What are well-informed industry analysts predicting for PZC’s future growth? Take a look at our free research report of analyst consensus for PZC’s outlook.
Valuation: What is PZC worth today? Is the stock undervalued, even when its growth outlook is factored into its intrinsic value? The intrinsic value infographic in our free research report helps visualize whether PZC is currently mispriced by the market.
Other High-Performing Stocks: Are there other stocks that provide better prospects with proven track records? Explore our free list of these great stocks here.
To help readers see past the short term volatility of the financial market, we aim to bring you a long-term focused research analysis purely driven by fundamental data. Note that our analysis does not factor in the latest price-sensitive company announcements.
The author is an independent contributor and at the time of publication had no position in the stocks mentioned. For errors that warrant correction please contact the editor at editorial-team@simplywallst.com.
