
 Yahoo Finance
 Does Qliro Group AB (publ)'s (STO:QLRO) Past Performance Indicate A Weaker Future?

For long-term investors, assessing earnings trend over time and against industry benchmarks is more beneficial than examining a single earnings announcement at a point in time. Investors may find my commentary, albeit very high-level and brief, on Qliro Group AB (publ) (OM:QLRO) useful as an attempt to give more color around how Qliro Group is currently performing.
View our latest analysis for Qliro Group
How Did QLRO's Recent Performance Stack Up Against Its Past?
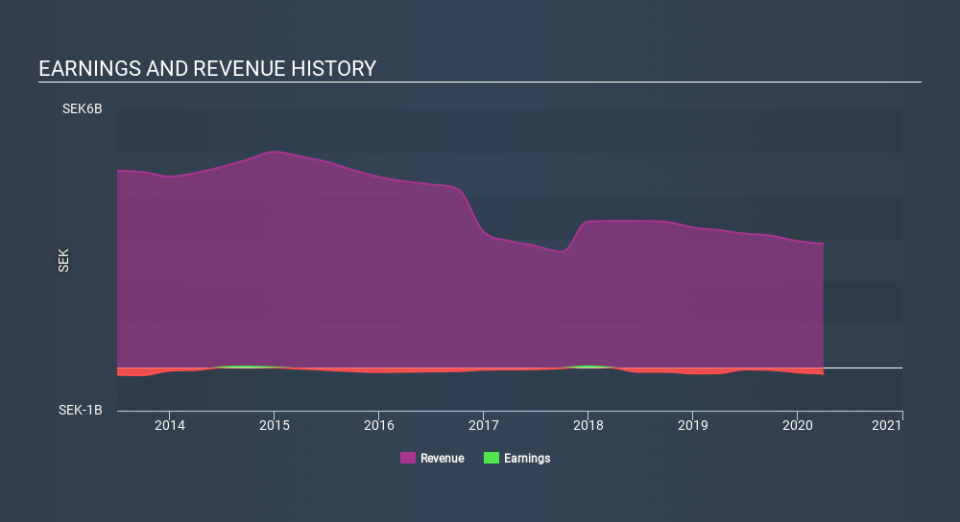
QLRO is loss-making, with the most recent trailing twelve-month earnings of -kr142.5m (from 31 March 2020), which compared to last year has become more negative. Furthermore, the company's loss seem to be growing over time, with the five-year earnings average of -kr66.7m. Each year, for the past five years QLRO has seen an annual decline in revenue of -10%, on average. This adverse movement is a driver of the company's inability to reach breakeven.
Viewing growth from a sector-level, the SE online retail industry has been growing, albeit, at a subdued single-digit rate of 9.6% in the previous twelve months, and a substantial 38% over the past five years. Since the Online Retail sector in SE is relatively small, I’ve included similar companies in the wider region in order to get a better idea of the growth, which is a median of profitable companies of companies such as Dustin Group, Boozt and Footway Group. This shows that whatever uplift the industry is profiting from, Qliro Group has not been able to gain as much as its industry peers.
Since Qliro Group is loss-making, with operating expenses (opex) growing year-on-year at 4.9%, it may need to raise more cash over the next year. It currently has kr169m in cash and short-term investments, however, opex (SG&A and one-year R&D) reachedkr820m in the latest twelve months. Although this is a relatively simplistic calculation, and Qliro Group may reduce its costs or raise debt capital instead of coming to equity markets, the analysis still gives us an idea of the company’s timeline and when things will have to start changing, since its current operation is unsustainable.
What does this mean?
Though Qliro Group's past data is helpful, it is only one aspect of my investment thesis. Companies that incur net loss is always difficult to predict what will happen in the future and when. The most valuable step is to assess company-specific issues Qliro Group may be facing and whether management guidance has steadily been met in the past. You should continue to research Qliro Group to get a more holistic view of the stock by looking at:
Financial Health: Are QLRO’s operations financially sustainable? Balance sheets can be hard to analyze, which is why we’ve done it for you. Check out our financial health checks here.
Other High-Performing Stocks: Are there other stocks that provide better prospects with proven track records? Explore our free list of these great stocks here.
NB: Figures in this article are calculated using data from the trailing twelve months from 31 March 2020. This may not be consistent with full year annual report figures.
If you spot an error that warrants correction, please contact the editor at editorial-team@simplywallst.com. This article by Simply Wall St is general in nature. It does not constitute a recommendation to buy or sell any stock, and does not take account of your objectives, or your financial situation. Simply Wall St has no position in the stocks mentioned.
We aim to bring you long-term focused research analysis driven by fundamental data. Note that our analysis may not factor in the latest price-sensitive company announcements or qualitative material. Thank you for reading.
