
 Yahoo Finance
 How Does Rank Group's (LON:RNK) P/E Compare To Its Industry, After The Share Price Drop?

To the annoyance of some shareholders, Rank Group (LON:RNK) shares are down a considerable 39% in the last month. The stock has been solid, longer term, gaining 16% in the last year.
Assuming nothing else has changed, a lower share price makes a stock more attractive to potential buyers. While the market sentiment towards a stock is very changeable, in the long run, the share price will tend to move in the same direction as earnings per share. The implication here is that long term investors have an opportunity when expectations of a company are too low. Perhaps the simplest way to get a read on investors' expectations of a business is to look at its Price to Earnings Ratio (PE Ratio). Investors have optimistic expectations of companies with higher P/E ratios, compared to companies with lower P/E ratios.
View our latest analysis for Rank Group
Does Rank Group Have A Relatively High Or Low P/E For Its Industry?
We can tell from its P/E ratio of 14.94 that sentiment around Rank Group isn't particularly high. We can see in the image below that the average P/E (17.9) for companies in the hospitality industry is higher than Rank Group's P/E.
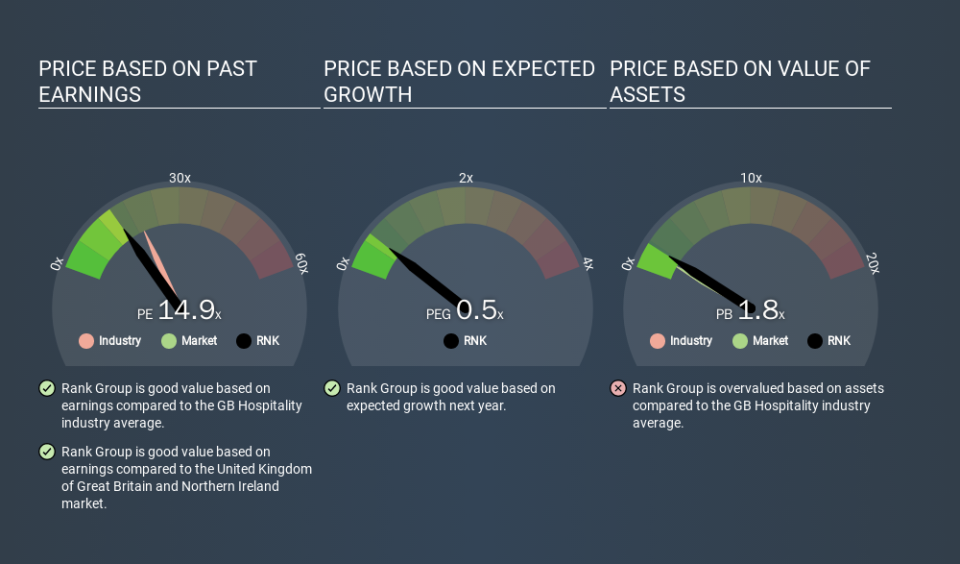
Its relatively low P/E ratio indicates that Rank Group shareholders think it will struggle to do as well as other companies in its industry classification. Since the market seems unimpressed with Rank Group, it's quite possible it could surprise on the upside. It is arguably worth checking if insiders are buying shares, because that might imply they believe the stock is undervalued.
How Growth Rates Impact P/E Ratios
If earnings fall then in the future the 'E' will be lower. That means even if the current P/E is low, it will increase over time if the share price stays flat. Then, a higher P/E might scare off shareholders, pushing the share price down.
Rank Group's earnings made like a rocket, taking off 65% last year. Unfortunately, earnings per share are down 7.3% a year, over 3 years.
Don't Forget: The P/E Does Not Account For Debt or Bank Deposits
It's important to note that the P/E ratio considers the market capitalization, not the enterprise value. In other words, it does not consider any debt or cash that the company may have on the balance sheet. In theory, a company can lower its future P/E ratio by using cash or debt to invest in growth.
While growth expenditure doesn't always pay off, the point is that it is a good option to have; but one that the P/E ratio ignores.
Is Debt Impacting Rank Group's P/E?
Net debt totals just 7.0% of Rank Group's market cap. The market might award it a higher P/E ratio if it had net cash, but its unlikely this low level of net borrowing is having a big impact on the P/E multiple.
The Bottom Line On Rank Group's P/E Ratio
Rank Group has a P/E of 14.9. That's around the same as the average in the GB market, which is 13.9. When you consider the impressive EPS growth last year (along with some debt), it seems the market has questions about whether rapid EPS growth will be sustained. Given analysts are expecting further growth, one might have expected a higher P/E ratio. That may be worth further research. Given Rank Group's P/E ratio has declined from 24.5 to 14.9 in the last month, we know for sure that the market is significantly less confident about the business today, than it was back then. For those who don't like to trade against momentum, that could be a warning sign, but a contrarian investor might want to take a closer look.
When the market is wrong about a stock, it gives savvy investors an opportunity. If the reality for a company is better than it expects, you can make money by buying and holding for the long term. So this free report on the analyst consensus forecasts could help you make a master move on this stock.
Of course you might be able to find a better stock than Rank Group. So you may wish to see this free collection of other companies that have grown earnings strongly.
If you spot an error that warrants correction, please contact the editor at editorial-team@simplywallst.com. This article by Simply Wall St is general in nature. It does not constitute a recommendation to buy or sell any stock, and does not take account of your objectives, or your financial situation. Simply Wall St has no position in the stocks mentioned.
We aim to bring you long-term focused research analysis driven by fundamental data. Note that our analysis may not factor in the latest price-sensitive company announcements or qualitative material. Thank you for reading.
