
 Yahoo Finance
 Does The Redrow plc (LON:RDW) Share Price Tend To Follow The Market?

Want to participate in a short research study? Help shape the future of investing tools and you could win a $250 gift card!
If you own shares in Redrow plc (LON:RDW) then it's worth thinking about how it contributes to the volatility of your portfolio, overall. In finance, Beta is a measure of volatility. Modern finance theory considers volatility to be a measure of risk, and there are two main types of price volatility. The first category is company specific volatility. This can be dealt with by limiting your exposure to any particular stock. The second sort is caused by the natural volatility of markets, overall. For example, certain macroeconomic events will impact (virtually) all stocks on the market.
Some stocks are more sensitive to general market forces than others. Beta can be a useful tool to understand how much a stock is influenced by market risk (volatility). However, Warren Buffett said 'volatility is far from synonymous with risk' in his 2014 letter to investors. So, while useful, beta is not the only metric to consider. To use beta as an investor, you must first understand that the overall market has a beta of one. A stock with a beta below one is either less volatile than the market, or more volatile but not corellated with the overall market. In comparison a stock with a beta of over one tends to be move in a similar direction to the market in the long term, but with greater changes in price.
See our latest analysis for Redrow
What we can learn from RDW's beta value
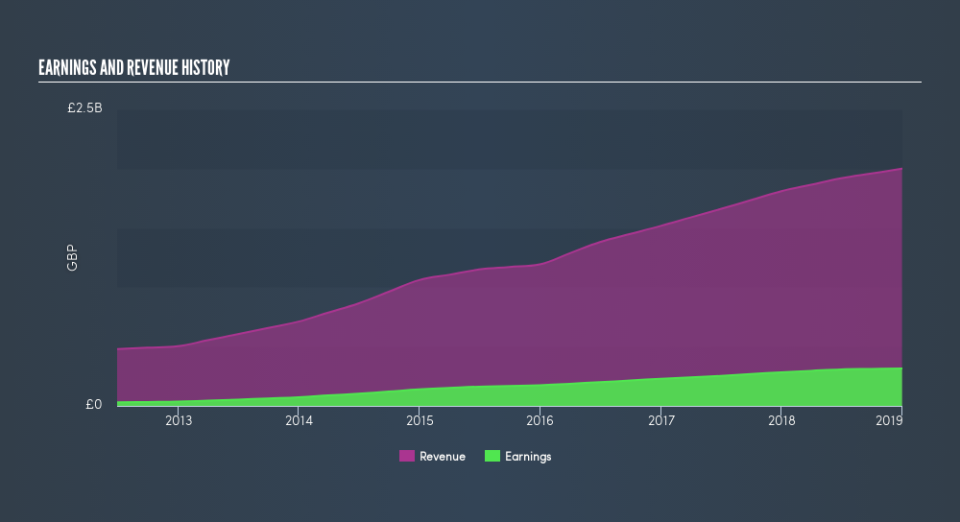
Given that it has a beta of 0.88, we can surmise that the Redrow share price has not been strongly impacted by broader market volatility (over the last 5 years). This means that -- if history is a guide -- buying the stock would reduce the impact of overall market volatility in many portfolios (depending on the beta of the portfolio, of course). Share price volatility is well worth considering, but most long term investors consider the history of revenue and earnings growth to be more important. Take a look at how Redrow fares in that regard, below.
Could RDW's size cause it to be more volatile?
With a market capitalisation of UK£1.9b, Redrow is a pretty big company, even by global standards. It is quite likely well known to very many investors. When large companies like this one have a low beta value, there is usually some other factor that is having an outsized impact on the share price. For example, a business with significant fixed regulated assets might earn a reasonably predictable return, regardless of broader macroeconomic factors. Alternatively, lumpy earnings might mean minimal share price correlation with the broader market.
What this means for you:
One potential advantage of owning low beta stocks like Redrow is that your overall portfolio won't be too sensitive to overall market movements. However, this can be a blessing or a curse, depending on what's happening in the broader market. This article aims to educate investors about beta values, but it's well worth looking at important company-specific fundamentals such as Redrow’s financial health and performance track record. I highly recommend you dive deeper by considering the following:
Future Outlook: What are well-informed industry analysts predicting for RDW’s future growth? Take a look at our free research report of analyst consensus for RDW’s outlook.
Past Track Record: Has RDW been consistently performing well irrespective of the ups and downs in the market? Go into more detail in the past performance analysis and take a look at the free visual representations of RDW's historicals for more clarity.
Other Interesting Stocks: It's worth checking to see how RDW measures up against other companies on valuation. You could start with this free list of prospective options.
We aim to bring you long-term focused research analysis driven by fundamental data. Note that our analysis may not factor in the latest price-sensitive company announcements or qualitative material.
If you spot an error that warrants correction, please contact the editor at editorial-team@simplywallst.com. This article by Simply Wall St is general in nature. It does not constitute a recommendation to buy or sell any stock, and does not take account of your objectives, or your financial situation. Simply Wall St has no position in the stocks mentioned. Thank you for reading.
