
 Yahoo Finance
 Does Renewable Energy Group, Inc.'s (NASDAQ:REGI) P/E Ratio Signal A Buying Opportunity?

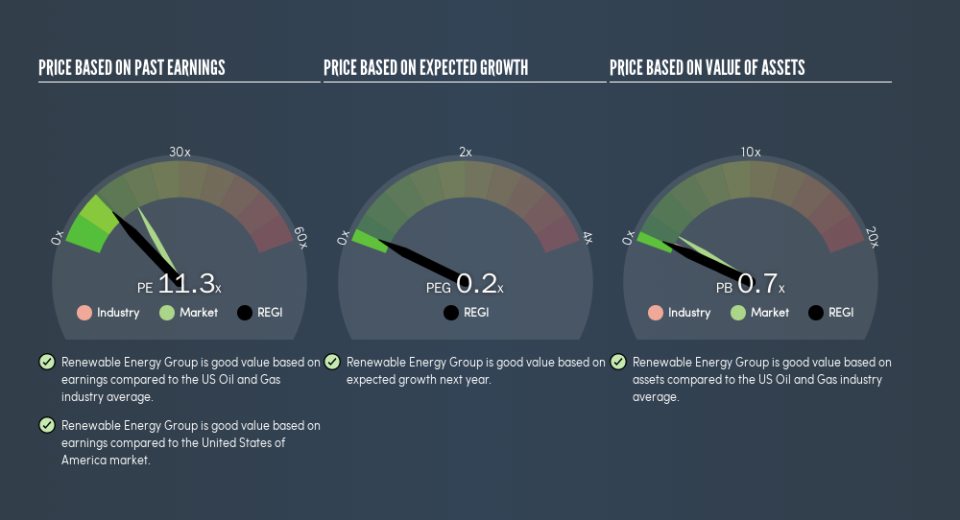
This article is written for those who want to get better at using price to earnings ratios (P/E ratios). We'll look at Renewable Energy Group, Inc.'s (NASDAQ:REGI) P/E ratio and reflect on what it tells us about the company's share price. Renewable Energy Group has a P/E ratio of 11.33, based on the last twelve months. That is equivalent to an earnings yield of about 8.8%.
View our latest analysis for Renewable Energy Group
How Do I Calculate A Price To Earnings Ratio?
The formula for price to earnings is:
Price to Earnings Ratio = Price per Share ÷ Earnings per Share (EPS)
Or for Renewable Energy Group:
P/E of 11.33 = $12.69 ÷ $1.12 (Based on the year to March 2019.)
Is A High Price-to-Earnings Ratio Good?
A higher P/E ratio means that buyers have to pay a higher price for each $1 the company has earned over the last year. That isn't a good or a bad thing on its own, but a high P/E means that buyers have a higher opinion of the business's prospects, relative to stocks with a lower P/E.
Does Renewable Energy Group Have A Relatively High Or Low P/E For Its Industry?
The P/E ratio essentially measures market expectations of a company. The image below shows that Renewable Energy Group has a P/E ratio that is roughly in line with the oil and gas industry average (11.4).
Renewable Energy Group's P/E tells us that market participants think its prospects are roughly in line with its industry. If the company has better than average prospects, then the market might be underestimating it. Checking factors such as director buying and selling. could help you form your own view on if that will happen.
How Growth Rates Impact P/E Ratios
P/E ratios primarily reflect market expectations around earnings growth rates. Earnings growth means that in the future the 'E' will be higher. That means unless the share price increases, the P/E will reduce in a few years. Then, a lower P/E should attract more buyers, pushing the share price up.
Renewable Energy Group's earnings per share fell by 73% in the last twelve months. And it has shrunk its earnings per share by 21% per year over the last five years. This could justify a pessimistic P/E.
Don't Forget: The P/E Does Not Account For Debt or Bank Deposits
One drawback of using a P/E ratio is that it considers market capitalization, but not the balance sheet. Thus, the metric does not reflect cash or debt held by the company. In theory, a company can lower its future P/E ratio by using cash or debt to invest in growth.
Such expenditure might be good or bad, in the long term, but the point here is that the balance sheet is not reflected by this ratio.
So What Does Renewable Energy Group's Balance Sheet Tell Us?
Renewable Energy Group's net debt equates to 30% of its market capitalization. While that's enough to warrant consideration, it doesn't really concern us.
The Bottom Line On Renewable Energy Group's P/E Ratio
Renewable Energy Group has a P/E of 11.3. That's below the average in the US market, which is 17.2. With only modest debt, it's likely the lack of EPS growth at least partially explains the pessimism implied by the P/E ratio.
Investors have an opportunity when market expectations about a stock are wrong. As value investor Benjamin Graham famously said, 'In the short run, the market is a voting machine but in the long run, it is a weighing machine.' So this free visual report on analyst forecasts could hold the key to an excellent investment decision.
You might be able to find a better buy than Renewable Energy Group. If you want a selection of possible winners, check out this free list of interesting companies that trade on a P/E below 20 (but have proven they can grow earnings).
We aim to bring you long-term focused research analysis driven by fundamental data. Note that our analysis may not factor in the latest price-sensitive company announcements or qualitative material.
If you spot an error that warrants correction, please contact the editor at editorial-team@simplywallst.com. This article by Simply Wall St is general in nature. It does not constitute a recommendation to buy or sell any stock, and does not take account of your objectives, or your financial situation. Simply Wall St has no position in the stocks mentioned. Thank you for reading.
