
 Yahoo Finance
 Does RSA Insurance Group's (LON:RSA) Share Price Gain of 27% Match Its Business Performance?

Stock pickers are generally looking for stocks that will outperform the broader market. And in our experience, buying the right stocks can give your wealth a significant boost. To wit, the RSA Insurance Group share price has climbed 27% in five years, easily topping the market return of 13% (ignoring dividends). On the other hand, the more recent gains haven't been so impressive, with shareholders gaining just 11% , including dividends .
View our latest analysis for RSA Insurance Group
To quote Buffett, 'Ships will sail around the world but the Flat Earth Society will flourish. There will continue to be wide discrepancies between price and value in the marketplace...' One way to examine how market sentiment has changed over time is to look at the interaction between a company's share price and its earnings per share (EPS).
During the five years of share price growth, RSA Insurance Group moved from a loss to profitability. That's generally thought to be a genuine positive, so we would expect to see an increasing share price. Since the company was unprofitable five years ago, but not three years ago, it's worth taking a look at the returns in the last three years, too. We can see that the RSA Insurance Group share price is down 2.4% in the last three years. In the same period, EPS is up 27% per year. So there seems to be a mismatch between the positive EPS growth and the change in the share price, which is down -0.8% per year.
You can see below how EPS has changed over time (discover the exact values by clicking on the image).
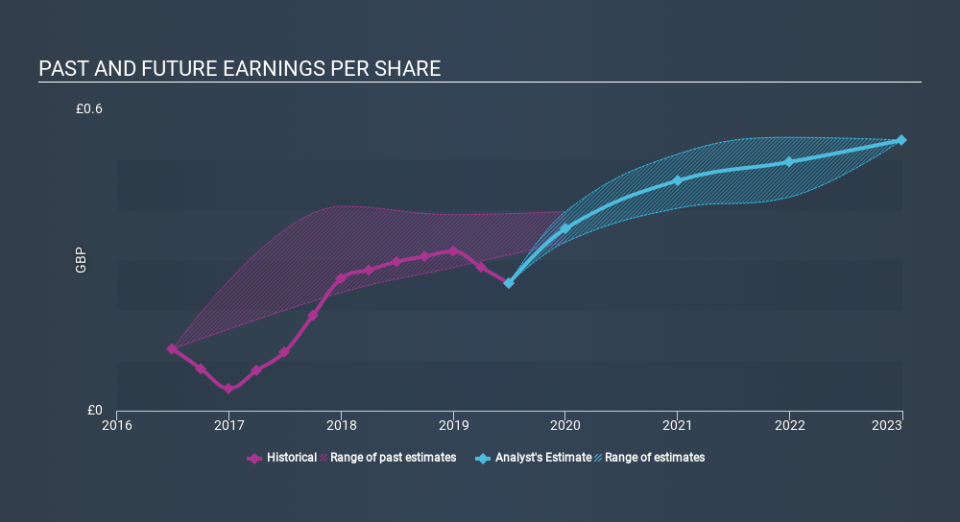
This free interactive report on RSA Insurance Group's earnings, revenue and cash flow is a great place to start, if you want to investigate the stock further.
What About Dividends?
It is important to consider the total shareholder return, as well as the share price return, for any given stock. The TSR is a return calculation that accounts for the value of cash dividends (assuming that any dividend received was reinvested) and the calculated value of any discounted capital raisings and spin-offs. It's fair to say that the TSR gives a more complete picture for stocks that pay a dividend. We note that for RSA Insurance Group the TSR over the last 5 years was 46%, which is better than the share price return mentioned above. And there's no prize for guessing that the dividend payments largely explain the divergence!
A Different Perspective
RSA Insurance Group provided a TSR of 11% over the last twelve months. But that was short of the market average. On the bright side, that's still a gain, and it's actually better than the average return of 7.9% over half a decade This suggests the company might be improving over time. Keeping this in mind, a solid next step might be to take a look at RSA Insurance Group's dividend track record. This free interactive graph is a great place to start.
If you like to buy stocks alongside management, then you might just love this free list of companies. (Hint: insiders have been buying them).
Please note, the market returns quoted in this article reflect the market weighted average returns of stocks that currently trade on GB exchanges.
If you spot an error that warrants correction, please contact the editor at editorial-team@simplywallst.com. This article by Simply Wall St is general in nature. It does not constitute a recommendation to buy or sell any stock, and does not take account of your objectives, or your financial situation. Simply Wall St has no position in the stocks mentioned.
We aim to bring you long-term focused research analysis driven by fundamental data. Note that our analysis may not factor in the latest price-sensitive company announcements or qualitative material. Thank you for reading.
