
 Yahoo Finance
 What Does Sbanken ASA's (OB:SBANK) P/E Ratio Tell You?

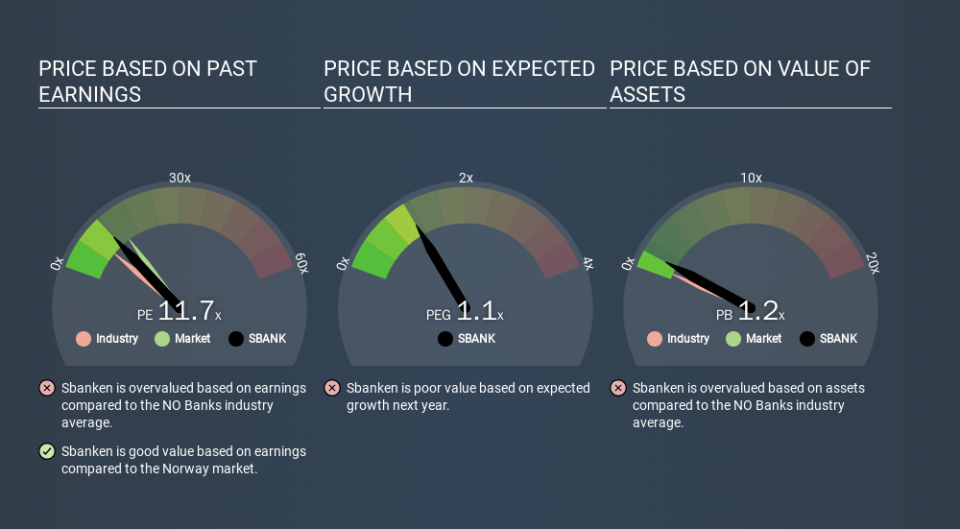
Today, we'll introduce the concept of the P/E ratio for those who are learning about investing. We'll apply a basic P/E ratio analysis to Sbanken ASA's (OB:SBANK), to help you decide if the stock is worth further research. Looking at earnings over the last twelve months, Sbanken has a P/E ratio of 11.67. That is equivalent to an earnings yield of about 8.6%.
See our latest analysis for Sbanken
How Do You Calculate A P/E Ratio?
The formula for P/E is:
Price to Earnings Ratio = Price per Share ÷ Earnings per Share (EPS)
Or for Sbanken:
P/E of 11.67 = NOK75.00 ÷ NOK6.43 (Based on the trailing twelve months to September 2019.)
Is A High Price-to-Earnings Ratio Good?
The higher the P/E ratio, the higher the price tag of a business, relative to its trailing earnings. All else being equal, it's better to pay a low price -- but as Warren Buffett said, 'It's far better to buy a wonderful company at a fair price than a fair company at a wonderful price'.
How Does Sbanken's P/E Ratio Compare To Its Peers?
The P/E ratio indicates whether the market has higher or lower expectations of a company. The image below shows that Sbanken has a higher P/E than the average (8.6) P/E for companies in the banks industry.
That means that the market expects Sbanken will outperform other companies in its industry. The market is optimistic about the future, but that doesn't guarantee future growth. So investors should always consider the P/E ratio alongside other factors, such as whether company directors have been buying shares.
How Growth Rates Impact P/E Ratios
If earnings fall then in the future the 'E' will be lower. Therefore, even if you pay a low multiple of earnings now, that multiple will become higher in the future. A higher P/E should indicate the stock is expensive relative to others -- and that may encourage shareholders to sell.
Sbanken shrunk earnings per share by 2.3% last year. And over the longer term (3 years) earnings per share have decreased 2.1% annually. So we might expect a relatively low P/E.
Remember: P/E Ratios Don't Consider The Balance Sheet
One drawback of using a P/E ratio is that it considers market capitalization, but not the balance sheet. In other words, it does not consider any debt or cash that the company may have on the balance sheet. Hypothetically, a company could reduce its future P/E ratio by spending its cash (or taking on debt) to achieve higher earnings.
Spending on growth might be good or bad a few years later, but the point is that the P/E ratio does not account for the option (or lack thereof).
Sbanken's Balance Sheet
Net debt totals a substantial 267% of Sbanken's market cap. This level of debt justifies a relatively low P/E, so remain cognizant of the debt, if you're comparing it to other stocks.
The Verdict On Sbanken's P/E Ratio
Sbanken trades on a P/E ratio of 11.7, which is below the NO market average of 14.5. Given meaningful debt, and a lack of recent growth, the market looks to be extrapolating this recent performance; reflecting low expectations for the future.
Investors have an opportunity when market expectations about a stock are wrong. If it is underestimating a company, investors can make money by buying and holding the shares until the market corrects itself. So this free visual report on analyst forecasts could hold the key to an excellent investment decision.
But note: Sbanken may not be the best stock to buy. So take a peek at this free list of interesting companies with strong recent earnings growth (and a P/E ratio below 20).
If you spot an error that warrants correction, please contact the editor at editorial-team@simplywallst.com. This article by Simply Wall St is general in nature. It does not constitute a recommendation to buy or sell any stock, and does not take account of your objectives, or your financial situation. Simply Wall St has no position in the stocks mentioned.
We aim to bring you long-term focused research analysis driven by fundamental data. Note that our analysis may not factor in the latest price-sensitive company announcements or qualitative material. Thank you for reading.
