
 Yahoo Finance
 Does Scientific Digital Imaging plc's (LON:SDI) P/E Ratio Signal A Buying Opportunity?

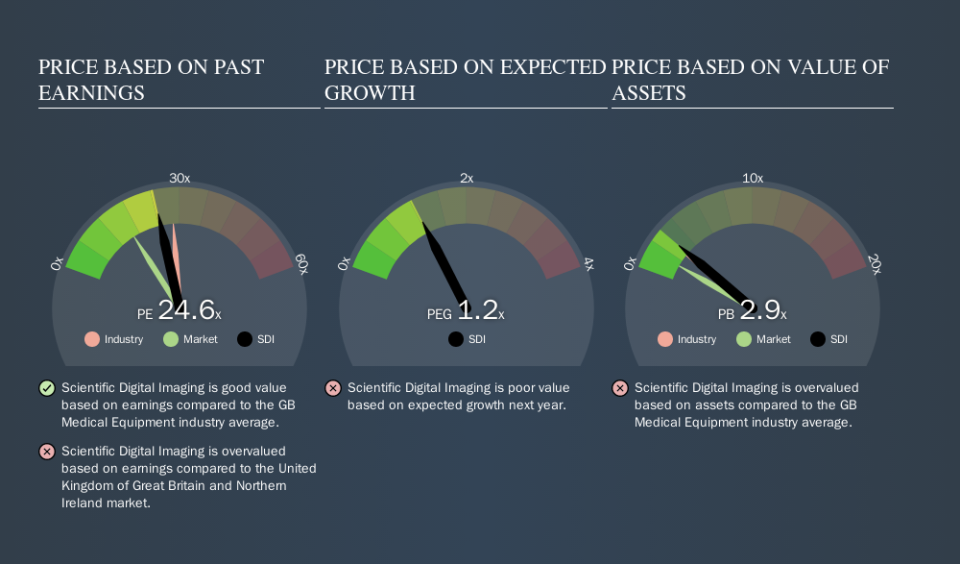
This article is written for those who want to get better at using price to earnings ratios (P/E ratios). We'll apply a basic P/E ratio analysis to Scientific Digital Imaging plc's (LON:SDI), to help you decide if the stock is worth further research. Based on the last twelve months, Scientific Digital Imaging's P/E ratio is 24.57. That corresponds to an earnings yield of approximately 4.1%.
View our latest analysis for Scientific Digital Imaging
How Do I Calculate A Price To Earnings Ratio?
The formula for P/E is:
Price to Earnings Ratio = Share Price ÷ Earnings per Share (EPS)
Or for Scientific Digital Imaging:
P/E of 24.57 = £0.52 ÷ £0.02 (Based on the year to April 2019.)
Is A High P/E Ratio Good?
A higher P/E ratio implies that investors pay a higher price for the earning power of the business. All else being equal, it's better to pay a low price -- but as Warren Buffett said, 'It's far better to buy a wonderful company at a fair price than a fair company at a wonderful price.
Does Scientific Digital Imaging Have A Relatively High Or Low P/E For Its Industry?
The P/E ratio essentially measures market expectations of a company. The image below shows that Scientific Digital Imaging has a lower P/E than the average (28.1) P/E for companies in the medical equipment industry.
Scientific Digital Imaging's P/E tells us that market participants think it will not fare as well as its peers in the same industry. Since the market seems unimpressed with Scientific Digital Imaging, it's quite possible it could surprise on the upside. You should delve deeper. I like to check if company insiders have been buying or selling.
How Growth Rates Impact P/E Ratios
P/E ratios primarily reflect market expectations around earnings growth rates. If earnings are growing quickly, then the 'E' in the equation will increase faster than it would otherwise. And in that case, the P/E ratio itself will drop rather quickly. Then, a lower P/E should attract more buyers, pushing the share price up.
Scientific Digital Imaging increased earnings per share by an impressive 16% over the last twelve months. And it has improved its earnings per share by 21% per year over the last three years. So one might expect an above average P/E ratio.
Remember: P/E Ratios Don't Consider The Balance Sheet
One drawback of using a P/E ratio is that it considers market capitalization, but not the balance sheet. Thus, the metric does not reflect cash or debt held by the company. In theory, a company can lower its future P/E ratio by using cash or debt to invest in growth.
Such expenditure might be good or bad, in the long term, but the point here is that the balance sheet is not reflected by this ratio.
So What Does Scientific Digital Imaging's Balance Sheet Tell Us?
Scientific Digital Imaging's net debt is 3.0% of its market cap. The market might award it a higher P/E ratio if it had net cash, but its unlikely this low level of net borrowing is having a big impact on the P/E multiple.
The Bottom Line On Scientific Digital Imaging's P/E Ratio
Scientific Digital Imaging trades on a P/E ratio of 24.6, which is above its market average of 16.1. Its debt levels do not imperil its balance sheet and it is growing EPS strongly. So on this analysis it seems reasonable that its P/E ratio is above average.
When the market is wrong about a stock, it gives savvy investors an opportunity. If the reality for a company is better than it expects, you can make money by buying and holding for the long term. So this free visual report on analyst forecasts could hold the key to an excellent investment decision.
But note: Scientific Digital Imaging may not be the best stock to buy. So take a peek at this free list of interesting companies with strong recent earnings growth (and a P/E ratio below 20).
We aim to bring you long-term focused research analysis driven by fundamental data. Note that our analysis may not factor in the latest price-sensitive company announcements or qualitative material.
If you spot an error that warrants correction, please contact the editor at editorial-team@simplywallst.com. This article by Simply Wall St is general in nature. It does not constitute a recommendation to buy or sell any stock, and does not take account of your objectives, or your financial situation. Simply Wall St has no position in the stocks mentioned. Thank you for reading.
