
 Yahoo Finance
 What Does Seaboard Corporation’s (NYSEMKT:SEB) P/E Ratio Tell You?

This article is for investors who would like to improve their understanding of price to earnings ratios (P/E ratios). We’ll show how you can use Seaboard Corporation’s (NYSEMKT:SEB) P/E ratio to inform your assessment of the investment opportunity. Seaboard has a price to earnings ratio of 43.14, based on the last twelve months. That means that at current prices, buyers pay $43.14 for every $1 in trailing yearly profits.
View our latest analysis for Seaboard
Want to help shape the future of investing tools and platforms? Take the survey and be part of one of the most advanced studies of stock market investors to date.
How Do You Calculate A P/E Ratio?
The formula for price to earnings is:
Price to Earnings Ratio = Price per Share ÷ Earnings per Share (EPS)
Or for Seaboard:
P/E of 43.14 = $3575.07 ÷ $82.87 (Based on the year to September 2018.)
Is A High Price-to-Earnings Ratio Good?
A higher P/E ratio means that investors are paying a higher price for each $1 of company earnings. All else being equal, it’s better to pay a low price — but as Warren Buffett said, ‘It’s far better to buy a wonderful company at a fair price than a fair company at a wonderful price.’
How Growth Rates Impact P/E Ratios
When earnings fall, the ‘E’ decreases, over time. That means unless the share price falls, the P/E will increase in a few years. A higher P/E should indicate the stock is expensive relative to others — and that may encourage shareholders to sell.
Seaboard’s earnings per share fell by 70% in the last twelve months. And it has shrunk its earnings per share by 2.9% per year over the last five years. This might lead to muted expectations.
How Does Seaboard’s P/E Ratio Compare To Its Peers?
The P/E ratio essentially measures market expectations of a company. You can see in the image below that the average P/E (17.1) for companies in the food industry is lower than Seaboard’s P/E.
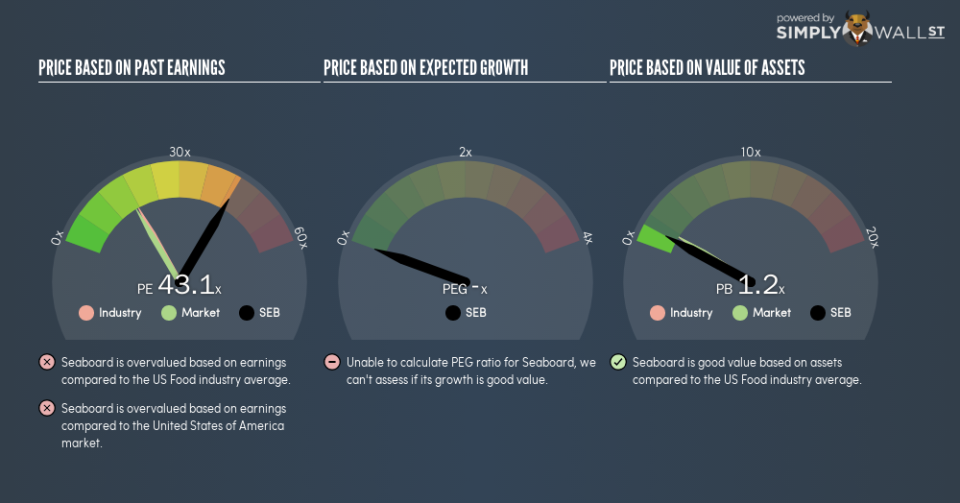
Seaboard’s P/E tells us that market participants think the company will perform better than its industry peers, going forward. The market is optimistic about the future, but that doesn’t guarantee future growth. So investors should delve deeper. I like to check if company insiders have been buying or selling.
Don’t Forget: The P/E Does Not Account For Debt or Bank Deposits
The ‘Price’ in P/E reflects the market capitalization of the company. In other words, it does not consider any debt or cash that the company may have on the balance sheet. Theoretically, a business can improve its earnings (and produce a lower P/E in the future), by taking on debt (or spending its remaining cash).
Such spending might be good or bad, overall, but the key point here is that you need to look at debt to understand the P/E ratio in context.
Is Debt Impacting Seaboard’s P/E?
Since Seaboard holds net cash of US$755m, it can spend on growth, justifying a higher P/E ratio than otherwise.
The Verdict On Seaboard’s P/E Ratio
Seaboard trades on a P/E ratio of 43.1, which is above the US market average of 16.8. The recent drop in earnings per share might keep value investors away, but the net cash position means the company has time to improve: and the high P/E suggests the market thinks it will.
Investors should be looking to buy stocks that the market is wrong about. People often underestimate remarkable growth — so investors can make money when fast growth is not fully appreciated. Although we don’t have analyst forecasts, you might want to assess this data-rich visualization of earnings, revenue and cash flow.
But note: Seaboard may not be the best stock to buy. So take a peek at this free list of interesting companies with strong recent earnings growth (and a P/E ratio below 20).
To help readers see past the short term volatility of the financial market, we aim to bring you a long-term focused research analysis purely driven by fundamental data. Note that our analysis does not factor in the latest price-sensitive company announcements.
The author is an independent contributor and at the time of publication had no position in the stocks mentioned. For errors that warrant correction please contact the editor at editorial-team@simplywallst.com.
