
 Yahoo Finance
 Does Semapa - Sociedade de Investimento e Gestão, SGPS, S.A.'s (ELI:SEM) P/E Ratio Signal A Buying Opportunity?

This article is written for those who want to get better at using price to earnings ratios (P/E ratios). We'll apply a basic P/E ratio analysis to Semapa - Sociedade de Investimento e Gestão, SGPS, S.A.'s (ELI:SEM), to help you decide if the stock is worth further research. What is Semapa - Sociedade de Investimento e Gestão SGPS's P/E ratio? Well, based on the last twelve months it is 7.31. In other words, at today's prices, investors are paying €7.31 for every €1 in prior year profit.
Check out our latest analysis for Semapa - Sociedade de Investimento e Gestão SGPS
How Do I Calculate A Price To Earnings Ratio?
The formula for P/E is:
Price to Earnings Ratio = Price per Share ÷ Earnings per Share (EPS)
Or for Semapa - Sociedade de Investimento e Gestão SGPS:
P/E of 7.31 = €13.34 ÷ €1.83 (Based on the year to September 2019.)
Is A High P/E Ratio Good?
A higher P/E ratio implies that investors pay a higher price for the earning power of the business. That isn't necessarily good or bad, but a high P/E implies relatively high expectations of what a company can achieve in the future.
Does Semapa - Sociedade de Investimento e Gestão SGPS Have A Relatively High Or Low P/E For Its Industry?
The P/E ratio indicates whether the market has higher or lower expectations of a company. If you look at the image below, you can see Semapa - Sociedade de Investimento e Gestão SGPS has a lower P/E than the average (11.8) in the forestry industry classification.
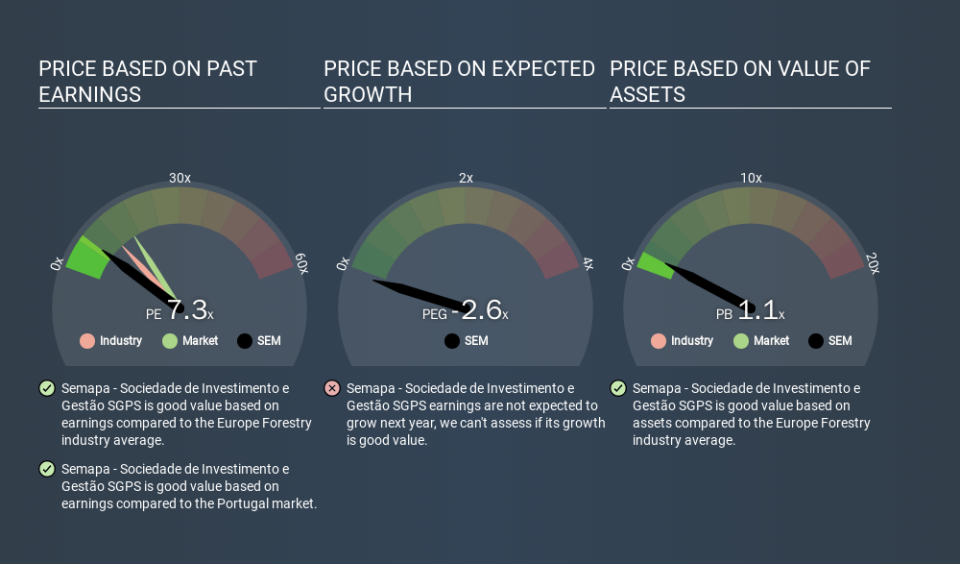
Its relatively low P/E ratio indicates that Semapa - Sociedade de Investimento e Gestão SGPS shareholders think it will struggle to do as well as other companies in its industry classification. Since the market seems unimpressed with Semapa - Sociedade de Investimento e Gestão SGPS, it's quite possible it could surprise on the upside. You should delve deeper. I like to check if company insiders have been buying or selling.
How Growth Rates Impact P/E Ratios
Probably the most important factor in determining what P/E a company trades on is the earnings growth. When earnings grow, the 'E' increases, over time. Therefore, even if you pay a high multiple of earnings now, that multiple will become lower in the future. Then, a lower P/E should attract more buyers, pushing the share price up.
Semapa - Sociedade de Investimento e Gestão SGPS saw earnings per share improve by -2.6% last year. And its annual EPS growth rate over 5 years is 5.6%.
A Limitation: P/E Ratios Ignore Debt and Cash In The Bank
Don't forget that the P/E ratio considers market capitalization. That means it doesn't take debt or cash into account. The exact same company would hypothetically deserve a higher P/E ratio if it had a strong balance sheet, than if it had a weak one with lots of debt, because a cashed up company can spend on growth.
Spending on growth might be good or bad a few years later, but the point is that the P/E ratio does not account for the option (or lack thereof).
Semapa - Sociedade de Investimento e Gestão SGPS's Balance Sheet
Net debt totals a substantial 144% of Semapa - Sociedade de Investimento e Gestão SGPS's market cap. This is a relatively high level of debt, so the stock probably deserves a relatively low P/E ratio. Keep that in mind when comparing it to other companies.
The Bottom Line On Semapa - Sociedade de Investimento e Gestão SGPS's P/E Ratio
Semapa - Sociedade de Investimento e Gestão SGPS trades on a P/E ratio of 7.3, which is below the PT market average of 16.2. The meaningful debt load is probably contributing to low expectations, even though it has improved earnings recently.
When the market is wrong about a stock, it gives savvy investors an opportunity. As value investor Benjamin Graham famously said, 'In the short run, the market is a voting machine but in the long run, it is a weighing machine. So this free visualization of the analyst consensus on future earnings could help you make the right decision about whether to buy, sell, or hold.
But note: Semapa - Sociedade de Investimento e Gestão SGPS may not be the best stock to buy. So take a peek at this free list of interesting companies with strong recent earnings growth (and a P/E ratio below 20).
If you spot an error that warrants correction, please contact the editor at editorial-team@simplywallst.com. This article by Simply Wall St is general in nature. It does not constitute a recommendation to buy or sell any stock, and does not take account of your objectives, or your financial situation. Simply Wall St has no position in the stocks mentioned.
We aim to bring you long-term focused research analysis driven by fundamental data. Note that our analysis may not factor in the latest price-sensitive company announcements or qualitative material. Thank you for reading.
