
 Yahoo Finance
 What Does SemGroup Corporation's (NYSE:SEMG) Balance Sheet Tell Us About It?

Want to participate in a short research study? Help shape the future of investing tools and you could win a $250 gift card!
Investors are always looking for growth in small-cap stocks like SemGroup Corporation (NYSE:SEMG), with a market cap of US$996m. However, an important fact which most ignore is: how financially healthy is the business? Since SEMG is loss-making right now, it’s vital to understand the current state of its operations and pathway to profitability. The following basic checks can help you get a picture of the company's balance sheet strength. However, this is not a comprehensive overview, so I suggest you dig deeper yourself into SEMG here.
Does SEMG Produce Much Cash Relative To Its Debt?
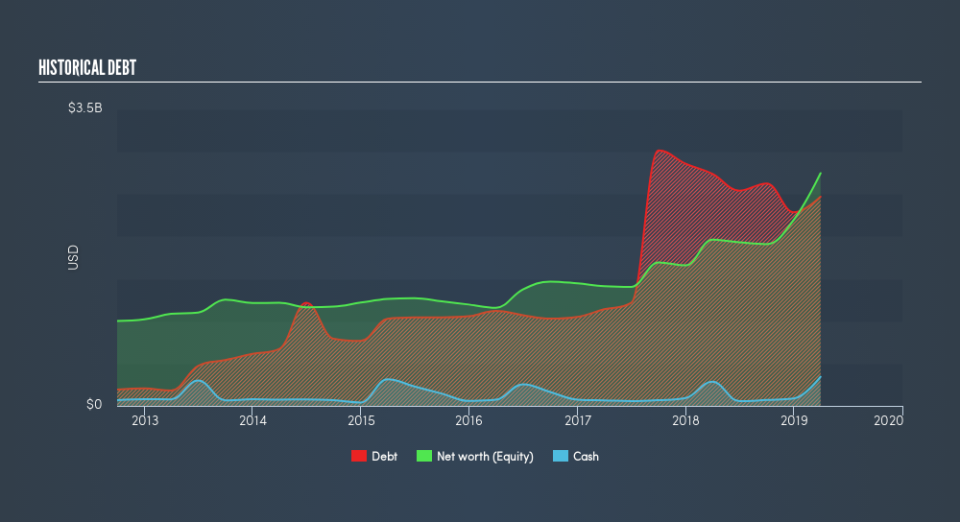
SEMG has shrunk its total debt levels in the last twelve months, from US$2.7b to US$2.5b , which also accounts for long term debt. With this debt repayment, SEMG currently has US$344m remaining in cash and short-term investments , ready to be used for running the business. Moreover, SEMG has generated cash from operations of US$239m during the same period of time, leading to an operating cash to total debt ratio of 9.7%, signalling that SEMG’s current level of operating cash is not high enough to cover debt.
Does SEMG’s liquid assets cover its short-term commitments?
With current liabilities at US$881m, it appears that the company has been able to meet these obligations given the level of current assets of US$1.2b, with a current ratio of 1.39x. The current ratio is the number you get when you divide current assets by current liabilities. Generally, for Oil and Gas companies, this is a reasonable ratio since there is a bit of a cash buffer without leaving too much capital in a low-return environment.
Does SEMG face the risk of succumbing to its debt-load?
SEMG is a relatively highly levered company with a debt-to-equity of 90%. This is a bit unusual for a small-cap stock, since they generally have a harder time borrowing than large more established companies. However, since SEMG is currently unprofitable, sustainability of its current state of operations becomes a concern. Maintaining a high level of debt, while revenues are still below costs, can be dangerous as liquidity tends to dry up in unexpected downturns.
Next Steps:
Although SEMG’s debt level is towards the higher end of the spectrum, its cash flow coverage seems adequate to meet obligations which means its debt is being efficiently utilised. Since there is also no concerns around SEMG's liquidity needs, this may be its optimal capital structure for the time being. This is only a rough assessment of financial health, and I'm sure SEMG has company-specific issues impacting its capital structure decisions. I suggest you continue to research SemGroup to get a better picture of the small-cap by looking at:
Future Outlook: What are well-informed industry analysts predicting for SEMG’s future growth? Take a look at our free research report of analyst consensus for SEMG’s outlook.
Historical Performance: What has SEMG's returns been like over the past? Go into more detail in the past track record analysis and take a look at the free visual representations of our analysis for more clarity.
Other High-Performing Stocks: Are there other stocks that provide better prospects with proven track records? Explore our free list of these great stocks here.
We aim to bring you long-term focused research analysis driven by fundamental data. Note that our analysis may not factor in the latest price-sensitive company announcements or qualitative material.
If you spot an error that warrants correction, please contact the editor at editorial-team@simplywallst.com. This article by Simply Wall St is general in nature. It does not constitute a recommendation to buy or sell any stock, and does not take account of your objectives, or your financial situation. Simply Wall St has no position in the stocks mentioned. Thank you for reading.
