
 Yahoo Finance
 Does It Make Sense To Buy CenturyLink, Inc. (NYSE:CTL) For Its Yield?

Today we'll take a closer look at CenturyLink, Inc. (NYSE:CTL) from a dividend investor's perspective. Owning a strong business and reinvesting the dividends is widely seen as an attractive way of growing your wealth. Yet sometimes, investors buy a stock for its dividend and lose money because the share price falls by more than they earned in dividend payments.
With CenturyLink yielding 7.1% and having paid a dividend for over 10 years, many investors likely find the company quite interesting. It would not be a surprise to discover that many investors buy it for the dividends. Some simple analysis can reduce the risk of holding CenturyLink for its dividend, and we'll focus on the most important aspects below.
Explore this interactive chart for our latest analysis on CenturyLink!
Payout ratios
Companies (usually) pay dividends out of their earnings. If a company is paying more than it earns, the dividend might have to be cut. Comparing dividend payments to a company's net profit after tax is a simple way of reality-checking whether a dividend is sustainable. While CenturyLink pays a dividend, it reported a loss over the last year. When a company is loss-making, we next need to check to see if its cash flows can support the dividend.
CenturyLink's cash payout ratio in the last year was 44%, which suggests dividends were well covered by cash generated by the business.
Is CenturyLink's Balance Sheet Risky?
Given CenturyLink is paying a dividend but reported a loss over the past year, we need to check its balance sheet for signs of financial distress. A quick check of its financial situation can be done with two ratios: net debt divided by EBITDA (earnings before interest, tax, depreciation and amortisation), and net interest cover. Net debt to EBITDA measures total debt load relative to company earnings (lower = less debt), while net interest cover measures the ability to pay interest on the debt (higher = greater ability to pay interest costs). With net debt of 3.65 times its EBITDA, investors are starting to take on a meaningful amount of risk, should the business enter a downturn.
We calculated its interest cover by measuring its earnings before interest and tax (EBIT), and dividing this by the company's net interest expense. Interest cover of 2.07 times its interest expense is starting to become a concern for CenturyLink, and be aware that lenders may place additional restrictions on the company as well.
We update our data on CenturyLink every 24 hours, so you can always get our latest analysis of its financial health, here.
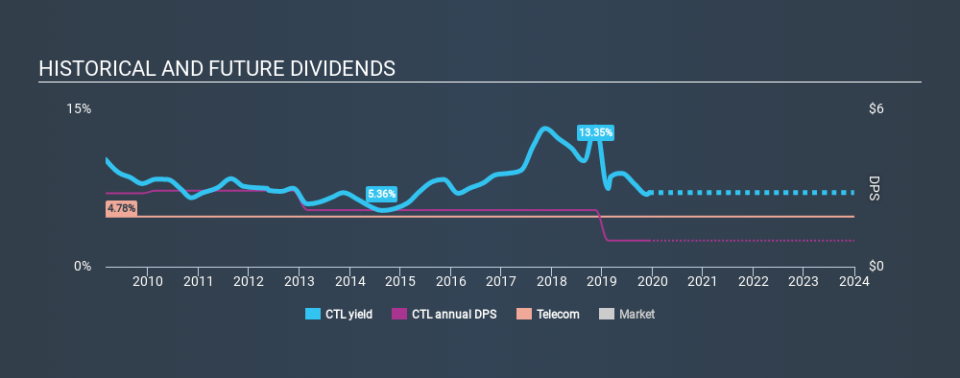
Dividend Volatility
From the perspective of an income investor who wants to earn dividends for many years, there is not much point buying a stock if its dividend is regularly cut or is not reliable. For the purpose of this article, we only scrutinise the last decade of CenturyLink's dividend payments. Its dividend payments have fallen by 20% or more on at least one occasion over the past ten years. During the past ten-year period, the first annual payment was US$2.80 in 2009, compared to US$1.00 last year. This works out to be a decline of approximately 9.8% per year over that time. CenturyLink's dividend hasn't shrunk linearly at 9.8% per annum, but the CAGR is a useful estimate of the historical rate of change.
A shrinking dividend over a ten-year period is not ideal, and we'd be concerned about investing in a dividend stock that lacks a solid record of growing dividends per share.
Dividend Growth Potential
Given that dividend payments have been shrinking like a glacier in a warming world, we need to check if there are some bright spots on the horizon. CenturyLink's EPS have fallen by approximately 58% per year during the past five years. With this kind of significant decline, we always wonder what has changed in the business. Dividends are about stability, and CenturyLink's earnings per share, which support the dividend, have been anything but stable.
Conclusion
Dividend investors should always want to know if a) a company's dividends are affordable, b) if there is a track record of consistent payments, and c) if the dividend is capable of growing. We're a bit uncomfortable with the company paying a dividend while being loss-making, although at least the dividend was covered by free cash flow. Second, earnings per share have been in decline, and its dividend has been cut at least once in the past. Overall, CenturyLink falls short in several key areas here. Unless the investor has strong grounds for an alternative conclusion, we find it hard to get interested in a dividend stock with these characteristics.
Without at least some growth in earnings per share over time, the dividend will eventually come under pressure either from costs or inflation. Very few businesses see earnings consistently shrink year after year in perpetuity though, and so it might be worth seeing what the 13 analysts we track are forecasting for the future.
We have also put together a list of global stocks with a market capitalisation above $1bn and yielding more 3%.
If you spot an error that warrants correction, please contact the editor at editorial-team@simplywallst.com. This article by Simply Wall St is general in nature. It does not constitute a recommendation to buy or sell any stock, and does not take account of your objectives, or your financial situation. Simply Wall St has no position in the stocks mentioned.
We aim to bring you long-term focused research analysis driven by fundamental data. Note that our analysis may not factor in the latest price-sensitive company announcements or qualitative material. Thank you for reading.
