
 Yahoo Finance
 How Does Sherwin-Williams's (NYSE:SHW) P/E Compare To Its Industry, After The Share Price Drop?

To the annoyance of some shareholders, Sherwin-Williams (NYSE:SHW) shares are down a considerable 31% in the last month. Even longer term holders have taken a real hit with the stock declining 7.1% in the last year.
Assuming nothing else has changed, a lower share price makes a stock more attractive to potential buyers. In the long term, share prices tend to follow earnings per share, but in the short term prices bounce around in response to short term factors (which are not always obvious). The implication here is that long term investors have an opportunity when expectations of a company are too low. One way to gauge market expectations of a stock is to look at its Price to Earnings Ratio (PE Ratio). A high P/E ratio means that investors have a high expectation about future growth, while a low P/E ratio means they have low expectations about future growth.
View our latest analysis for Sherwin-Williams
Does Sherwin-Williams Have A Relatively High Or Low P/E For Its Industry?
Sherwin-Williams's P/E of 24.00 indicates some degree of optimism towards the stock. You can see in the image below that the average P/E (13.7) for companies in the chemicals industry is lower than Sherwin-Williams's P/E.
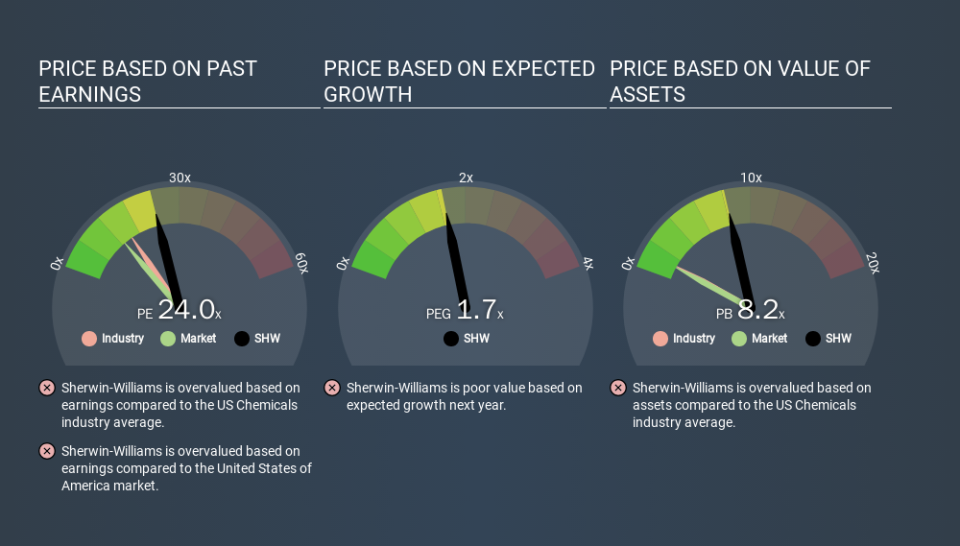
Sherwin-Williams's P/E tells us that market participants think the company will perform better than its industry peers, going forward. The market is optimistic about the future, but that doesn't guarantee future growth. So investors should delve deeper. I like to check if company insiders have been buying or selling.
How Growth Rates Impact P/E Ratios
Earnings growth rates have a big influence on P/E ratios. If earnings are growing quickly, then the 'E' in the equation will increase faster than it would otherwise. Therefore, even if you pay a high multiple of earnings now, that multiple will become lower in the future. So while a stock may look expensive based on past earnings, it could be cheap based on future earnings.
Notably, Sherwin-Williams grew EPS by a whopping 41% in the last year. And earnings per share have improved by 13% annually, over the last five years. So we'd generally expect it to have a relatively high P/E ratio.
Remember: P/E Ratios Don't Consider The Balance Sheet
Don't forget that the P/E ratio considers market capitalization. In other words, it does not consider any debt or cash that the company may have on the balance sheet. In theory, a company can lower its future P/E ratio by using cash or debt to invest in growth.
While growth expenditure doesn't always pay off, the point is that it is a good option to have; but one that the P/E ratio ignores.
Sherwin-Williams's Balance Sheet
Sherwin-Williams's net debt equates to 25% of its market capitalization. While that's enough to warrant consideration, it doesn't really concern us.
The Verdict On Sherwin-Williams's P/E Ratio
Sherwin-Williams trades on a P/E ratio of 24.0, which is above its market average of 11.8. While the company does use modest debt, its recent earnings growth is superb. So to be frank we are not surprised it has a high P/E ratio. What can be absolutely certain is that the market has become significantly less optimistic about Sherwin-Williams over the last month, with the P/E ratio falling from 34.7 back then to 24.0 today. For those who prefer to invest with the flow of momentum, that might be a bad sign, but for a contrarian, it may signal opportunity.
Investors have an opportunity when market expectations about a stock are wrong. As value investor Benjamin Graham famously said, 'In the short run, the market is a voting machine but in the long run, it is a weighing machine. So this free report on the analyst consensus forecasts could help you make a master move on this stock.
Of course, you might find a fantastic investment by looking at a few good candidates. So take a peek at this free list of companies with modest (or no) debt, trading on a P/E below 20.
If you spot an error that warrants correction, please contact the editor at editorial-team@simplywallst.com. This article by Simply Wall St is general in nature. It does not constitute a recommendation to buy or sell any stock, and does not take account of your objectives, or your financial situation. Simply Wall St has no position in the stocks mentioned.
We aim to bring you long-term focused research analysis driven by fundamental data. Note that our analysis may not factor in the latest price-sensitive company announcements or qualitative material. Thank you for reading.
