
 Yahoo Finance
 How Does Solaris Oilfield Infrastructure's (NYSE:SOI) P/E Compare To Its Industry, After Its Big Share Price Gain?

Solaris Oilfield Infrastructure (NYSE:SOI) shareholders are no doubt pleased to see that the share price has had a great month, posting a 32% gain, recovering from prior weakness. And the full year gain of 22% isn't too shabby, either!
All else being equal, a sharp share price increase should make a stock less attractive to potential investors. In the long term, share prices tend to follow earnings per share, but in the short term prices bounce around in response to short term factors (which are not always obvious). So some would prefer to hold off buying when there is a lot of optimism towards a stock. One way to gauge market expectations of a stock is to look at its Price to Earnings Ratio (PE Ratio). A high P/E ratio means that investors have a high expectation about future growth, while a low P/E ratio means they have low expectations about future growth.
See our latest analysis for Solaris Oilfield Infrastructure
How Does Solaris Oilfield Infrastructure's P/E Ratio Compare To Its Peers?
We can tell from its P/E ratio of 7.90 that sentiment around Solaris Oilfield Infrastructure isn't particularly high. If you look at the image below, you can see Solaris Oilfield Infrastructure has a lower P/E than the average (16.1) in the energy services industry classification.
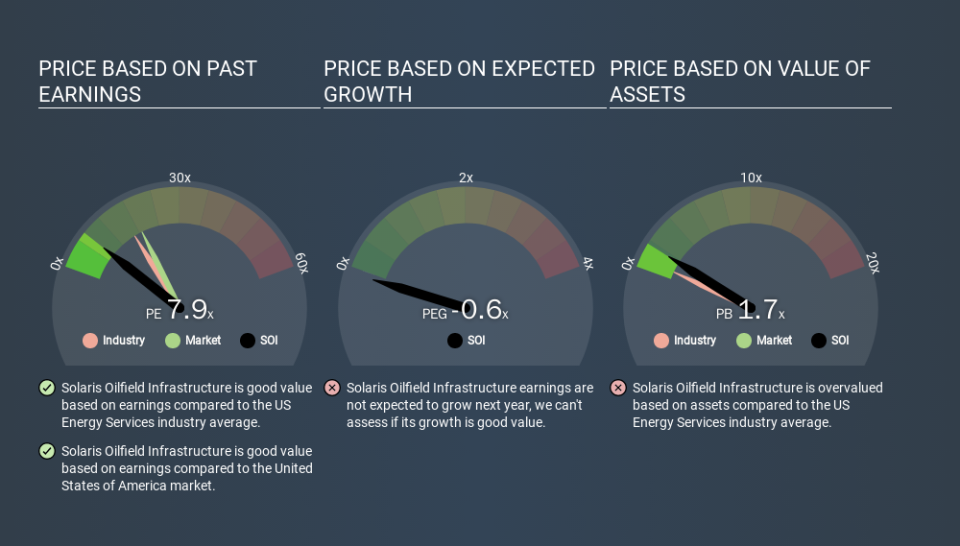
Its relatively low P/E ratio indicates that Solaris Oilfield Infrastructure shareholders think it will struggle to do as well as other companies in its industry classification. Since the market seems unimpressed with Solaris Oilfield Infrastructure, it's quite possible it could surprise on the upside. It is arguably worth checking if insiders are buying shares, because that might imply they believe the stock is undervalued.
How Growth Rates Impact P/E Ratios
Probably the most important factor in determining what P/E a company trades on is the earnings growth. When earnings grow, the 'E' increases, over time. And in that case, the P/E ratio itself will drop rather quickly. So while a stock may look expensive based on past earnings, it could be cheap based on future earnings.
Solaris Oilfield Infrastructure's 84% EPS improvement over the last year was like bamboo growth after rain; rapid and impressive.
Remember: P/E Ratios Don't Consider The Balance Sheet
Don't forget that the P/E ratio considers market capitalization. That means it doesn't take debt or cash into account. The exact same company would hypothetically deserve a higher P/E ratio if it had a strong balance sheet, than if it had a weak one with lots of debt, because a cashed up company can spend on growth.
Such expenditure might be good or bad, in the long term, but the point here is that the balance sheet is not reflected by this ratio.
So What Does Solaris Oilfield Infrastructure's Balance Sheet Tell Us?
Solaris Oilfield Infrastructure has net cash of US$53m. That should lead to a higher P/E than if it did have debt, because its strong balance sheets gives it more options.
The Verdict On Solaris Oilfield Infrastructure's P/E Ratio
Solaris Oilfield Infrastructure has a P/E of 7.9. That's below the average in the US market, which is 18.8. It grew its EPS nicely over the last year, and the healthy balance sheet implies there is more potential for growth. The relatively low P/E ratio implies the market is pessimistic. Because analysts are predicting more growth in the future, one might have expected to see a higher P/E ratio. You can take a closer look at the fundamentals, here. What we know for sure is that investors are becoming less uncomfortable about Solaris Oilfield Infrastructure's prospects, since they have pushed its P/E ratio from 6.0 to 7.9 over the last month. If you like to buy stocks that could be turnaround opportunities, then this one might be a candidate; but if you're more sensitive to price, then you may feel the opportunity has passed.
Investors have an opportunity when market expectations about a stock are wrong. As value investor Benjamin Graham famously said, 'In the short run, the market is a voting machine but in the long run, it is a weighing machine. So this free visual report on analyst forecasts could hold the key to an excellent investment decision.
You might be able to find a better buy than Solaris Oilfield Infrastructure. If you want a selection of possible winners, check out this free list of interesting companies that trade on a P/E below 20 (but have proven they can grow earnings).
If you spot an error that warrants correction, please contact the editor at editorial-team@simplywallst.com. This article by Simply Wall St is general in nature. It does not constitute a recommendation to buy or sell any stock, and does not take account of your objectives, or your financial situation. Simply Wall St has no position in the stocks mentioned.
We aim to bring you long-term focused research analysis driven by fundamental data. Note that our analysis may not factor in the latest price-sensitive company announcements or qualitative material. Thank you for reading.
