
 Yahoo Finance
 Does Standard Chartered's (LON:STAN) Share Price Gain of 30% Match Its Business Performance?

If you want to compound wealth in the stock market, you can do so by buying an index fund. But one can do better than that by picking better than average stocks (as part of a diversified portfolio). For example, the Standard Chartered PLC (LON:STAN) share price is up 30% in the last year, clearly besting the market return of around 2.8% (not including dividends). If it can keep that out-performance up over the long term, investors will do very well! The longer term returns have not been as good, with the stock price only 14% higher than it was three years ago.
Check out our latest analysis for Standard Chartered
To paraphrase Benjamin Graham: Over the short term the market is a voting machine, but over the long term it's a weighing machine. One way to examine how market sentiment has changed over time is to look at the interaction between a company's share price and its earnings per share (EPS).
Over the last twelve months, Standard Chartered actually shrank its EPS by 54%.
So we don't think that investors are paying too much attention to EPS. Therefore, it seems likely that investors are putting more weight on metrics other than EPS, at the moment.
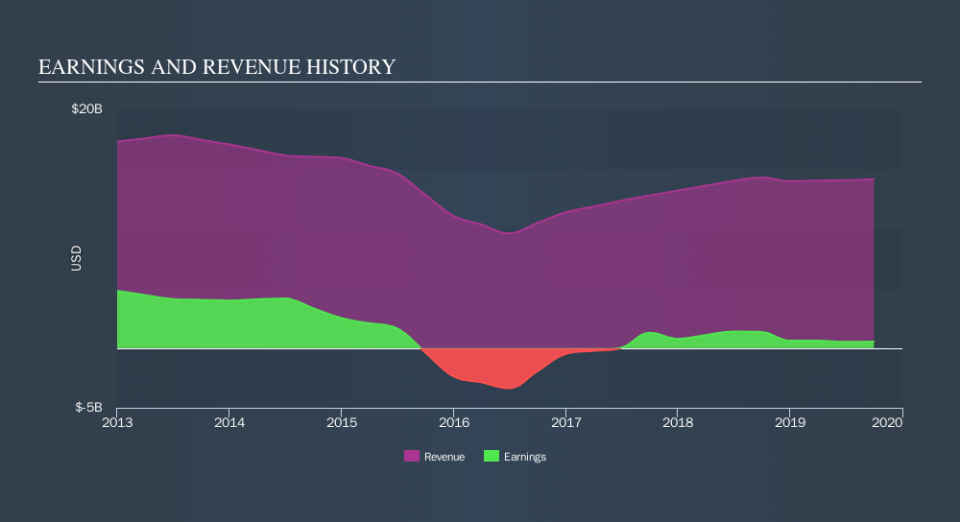
Revenue was pretty stable on last year, so deeper research might be needed to explain the share price rise.
You can see below how earnings and revenue have changed over time (discover the exact values by clicking on the image).
We like that insiders have been buying shares in the last twelve months. Having said that, most people consider earnings and revenue growth trends to be a more meaningful guide to the business. You can see what analysts are predicting for Standard Chartered in this interactive graph of future profit estimates.
What About Dividends?
As well as measuring the share price return, investors should also consider the total shareholder return (TSR). The TSR is a return calculation that accounts for the value of cash dividends (assuming that any dividend received was reinvested) and the calculated value of any discounted capital raisings and spin-offs. It's fair to say that the TSR gives a more complete picture for stocks that pay a dividend. We note that for Standard Chartered the TSR over the last year was 34%, which is better than the share price return mentioned above. And there's no prize for guessing that the dividend payments largely explain the divergence!
A Different Perspective
It's nice to see that Standard Chartered shareholders have received a total shareholder return of 34% over the last year. Of course, that includes the dividend. There's no doubt those recent returns are much better than the TSR loss of 2.0% per year over five years. This makes us a little wary, but the business might have turned around its fortunes. Investors who like to make money usually check up on insider purchases, such as the price paid, and total amount bought. You can find out about the insider purchases of Standard Chartered by clicking this link.
There are plenty of other companies that have insiders buying up shares. You probably do not want to miss this free list of growing companies that insiders are buying.
Please note, the market returns quoted in this article reflect the market weighted average returns of stocks that currently trade on GB exchanges.
We aim to bring you long-term focused research analysis driven by fundamental data. Note that our analysis may not factor in the latest price-sensitive company announcements or qualitative material.
If you spot an error that warrants correction, please contact the editor at editorial-team@simplywallst.com. This article by Simply Wall St is general in nature. It does not constitute a recommendation to buy or sell any stock, and does not take account of your objectives, or your financial situation. Simply Wall St has no position in the stocks mentioned. Thank you for reading.