
 Yahoo Finance
 How Does Stobart Group's (LON:STOB) CEO Salary Compare to Peers?
This article will reflect on the compensation paid to Warwick Brady who has served as CEO of Stobart Group Limited (LON:STOB) since 2017. This analysis will also assess whether Stobart Group pays its CEO appropriately, considering recent earnings growth and total shareholder returns.
See our latest analysis for Stobart Group
Comparing Stobart Group Limited's CEO Compensation With the industry
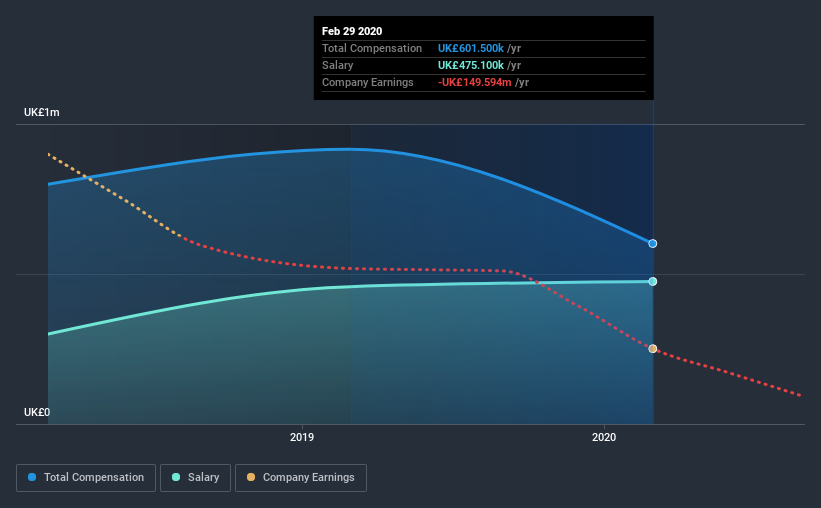
According to our data, Stobart Group Limited has a market capitalization of UK£159m, and paid its CEO total annual compensation worth UK£602k over the year to February 2020. We note that's a decrease of 34% compared to last year. We note that the salary portion, which stands at UK£475.1k constitutes the majority of total compensation received by the CEO.
For comparison, other companies in the same industry with market capitalizations ranging between UK£74m and UK£294m had a median total CEO compensation of UK£506k. From this we gather that Warwick Brady is paid around the median for CEOs in the industry. Furthermore, Warwick Brady directly owns UK£103k worth of shares in the company.
Component | 2020 | 2019 | Proportion (2020) |
Salary | UK£475k | UK£458k | 79% |
Other | UK£126k | UK£458k | 21% |
Total Compensation | UK£602k | UK£916k | 100% |
Talking in terms of the industry, salary represented approximately 79% of total compensation out of all the companies we analyzed, while other remuneration made up 21% of the pie. Our data reveals that Stobart Group allocates salary more or less in line with the wider market. If salary is the major component in total compensation, it suggests that the CEO receives a higher fixed proportion of the total compensation, regardless of performance.
A Look at Stobart Group Limited's Growth Numbers
Over the last three years, Stobart Group Limited has shrunk its earnings per share by 111% per year. It saw its revenue drop 2.4% over the last year.
Few shareholders would be pleased to read that EPS have declined. And the fact that revenue is down year on year arguably paints an ugly picture. These factors suggest that the business performance wouldn't really justify a high pay packet for the CEO. Moving away from current form for a second, it could be important to check this free visual depiction of what analysts expect for the future.
Has Stobart Group Limited Been A Good Investment?
Given the total shareholder loss of 90% over three years, many shareholders in Stobart Group Limited are probably rather dissatisfied, to say the least. So shareholders would probably want the company to be lessto generous with CEO compensation.
To Conclude...
As we touched on above, Stobart Group Limited is currently paying a compensation that's close to the median pay for CEOs of companies belonging to the same industry and with similar market capitalizations. On the other hand, EPS growth and total shareholder return have been negative for the last three years. We'd stop short of saying compensation is inappropriate, but we would understand if shareholders had questions regarding a future raise.
It is always advisable to analyse CEO pay, along with performing a thorough analysis of the company's key performance areas. We did our research and identified 4 warning signs (and 3 which are significant) in Stobart Group we think you should know about.
Switching gears from Stobart Group, if you're hunting for a pristine balance sheet and premium returns, this free list of high return, low debt companies is a great place to look.
This article by Simply Wall St is general in nature. It does not constitute a recommendation to buy or sell any stock, and does not take account of your objectives, or your financial situation. We aim to bring you long-term focused analysis driven by fundamental data. Note that our analysis may not factor in the latest price-sensitive company announcements or qualitative material. Simply Wall St has no position in any stocks mentioned.
Have feedback on this article? Concerned about the content? Get in touch with us directly. Alternatively, email editorial-team (at) simplywallst.com.
