
 Yahoo Finance
 How Does Terveystalo Oyj's (HEL:TTALO) P/E Compare To Its Industry, After The Share Price Drop?

Unfortunately for some shareholders, the Terveystalo Oyj (HEL:TTALO) share price has dived 33% in the last thirty days. Even longer term holders have taken a real hit with the stock declining 13% in the last year.
Assuming nothing else has changed, a lower share price makes a stock more attractive to potential buyers. While the market sentiment towards a stock is very changeable, in the long run, the share price will tend to move in the same direction as earnings per share. The implication here is that long term investors have an opportunity when expectations of a company are too low. Perhaps the simplest way to get a read on investors' expectations of a business is to look at its Price to Earnings Ratio (PE Ratio). A high P/E implies that investors have high expectations of what a company can achieve compared to a company with a low P/E ratio.
Check out our latest analysis for Terveystalo Oyj
How Does Terveystalo Oyj's P/E Ratio Compare To Its Peers?
Terveystalo Oyj's P/E is 19.03. As you can see below Terveystalo Oyj has a P/E ratio that is fairly close for the average for the healthcare industry, which is 18.7.
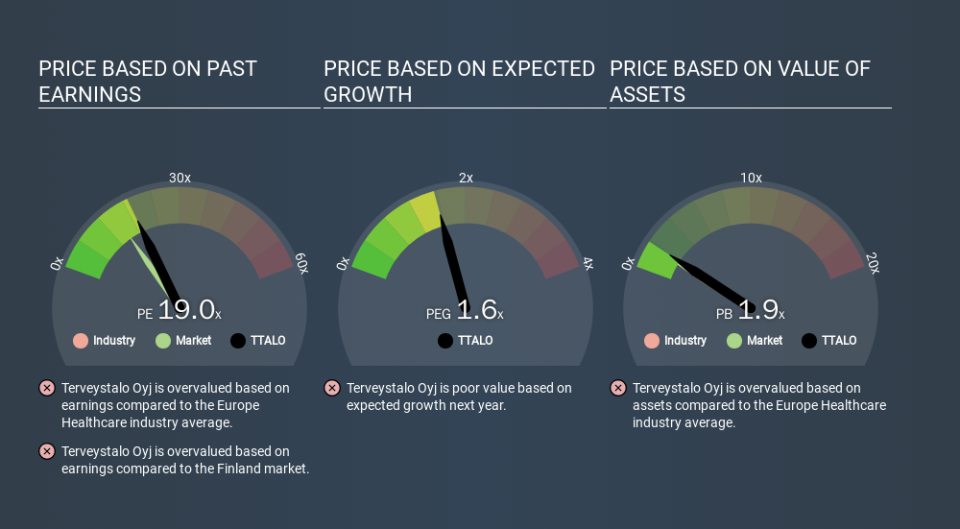
Terveystalo Oyj's P/E tells us that market participants think its prospects are roughly in line with its industry. The company could surprise by performing better than average, in the future. I would further inform my view by checking insider buying and selling., among other things.
How Growth Rates Impact P/E Ratios
P/E ratios primarily reflect market expectations around earnings growth rates. That's because companies that grow earnings per share quickly will rapidly increase the 'E' in the equation. That means even if the current P/E is high, it will reduce over time if the share price stays flat. A lower P/E should indicate the stock is cheap relative to others -- and that may attract buyers.
Terveystalo Oyj saw earnings per share decrease by 21% last year. But it has grown its earnings per share by 58% per year over the last three years.
A Limitation: P/E Ratios Ignore Debt and Cash In The Bank
One drawback of using a P/E ratio is that it considers market capitalization, but not the balance sheet. In other words, it does not consider any debt or cash that the company may have on the balance sheet. Theoretically, a business can improve its earnings (and produce a lower P/E in the future) by investing in growth. That means taking on debt (or spending its cash).
While growth expenditure doesn't always pay off, the point is that it is a good option to have; but one that the P/E ratio ignores.
How Does Terveystalo Oyj's Debt Impact Its P/E Ratio?
Terveystalo Oyj has net debt equal to 32% of its market cap. While that's enough to warrant consideration, it doesn't really concern us.
The Bottom Line On Terveystalo Oyj's P/E Ratio
Terveystalo Oyj has a P/E of 19.0. That's higher than the average in its market, which is 14.7. With modest debt but no EPS growth in the last year, it's fair to say the P/E implies some optimism about future earnings, from the market. What can be absolutely certain is that the market has become significantly less optimistic about Terveystalo Oyj over the last month, with the P/E ratio falling from 28.4 back then to 19.0 today. For those who prefer to invest with the flow of momentum, that might be a bad sign, but for a contrarian, it may signal opportunity.
Investors should be looking to buy stocks that the market is wrong about. If the reality for a company is better than it expects, you can make money by buying and holding for the long term. So this free report on the analyst consensus forecasts could help you make a master move on this stock.
Of course, you might find a fantastic investment by looking at a few good candidates. So take a peek at this free list of companies with modest (or no) debt, trading on a P/E below 20.
If you spot an error that warrants correction, please contact the editor at editorial-team@simplywallst.com. This article by Simply Wall St is general in nature. It does not constitute a recommendation to buy or sell any stock, and does not take account of your objectives, or your financial situation. Simply Wall St has no position in the stocks mentioned.
We aim to bring you long-term focused research analysis driven by fundamental data. Note that our analysis may not factor in the latest price-sensitive company announcements or qualitative material. Thank you for reading.
