
 Yahoo Finance
 How Does Textron's (NYSE:TXT) P/E Compare To Its Industry, After The Share Price Drop?

To the annoyance of some shareholders, Textron (NYSE:TXT) shares are down a considerable 39% in the last month. Indeed the recent decline has arguably caused some bitterness for shareholders who have held through the 40% drop over twelve months.
All else being equal, a share price drop should make a stock more attractive to potential investors. In the long term, share prices tend to follow earnings per share, but in the short term prices bounce around in response to short term factors (which are not always obvious). The implication here is that long term investors have an opportunity when expectations of a company are too low. Perhaps the simplest way to get a read on investors' expectations of a business is to look at its Price to Earnings Ratio (PE Ratio). Investors have optimistic expectations of companies with higher P/E ratios, compared to companies with lower P/E ratios.
View our latest analysis for Textron
How Does Textron's P/E Ratio Compare To Its Peers?
Textron's P/E of 8.81 indicates relatively low sentiment towards the stock. The image below shows that Textron has a lower P/E than the average (15.6) P/E for companies in the aerospace & defense industry.
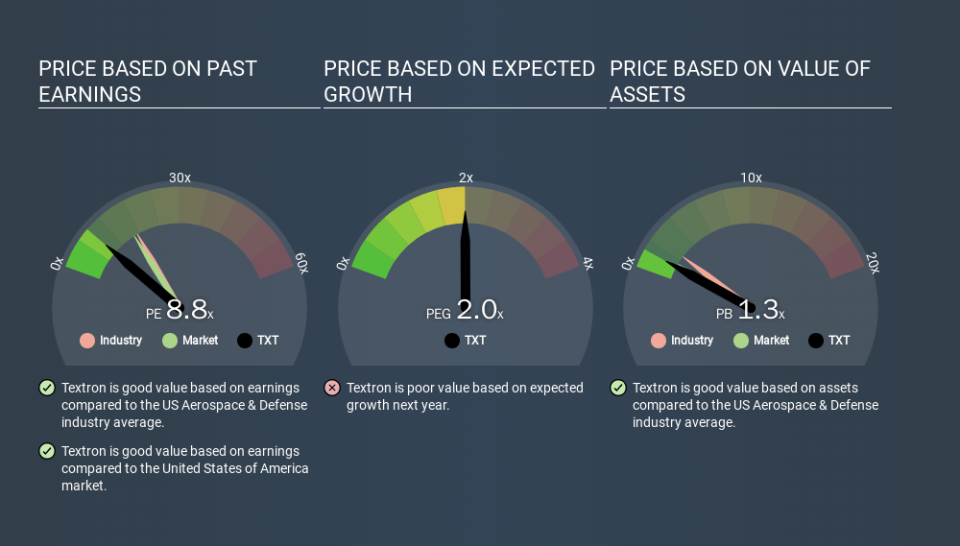
This suggests that market participants think Textron will underperform other companies in its industry. Many investors like to buy stocks when the market is pessimistic about their prospects. You should delve deeper. I like to check if company insiders have been buying or selling.
How Growth Rates Impact P/E Ratios
Earnings growth rates have a big influence on P/E ratios. When earnings grow, the 'E' increases, over time. Therefore, even if you pay a high multiple of earnings now, that multiple will become lower in the future. Then, a lower P/E should attract more buyers, pushing the share price up.
Textron saw earnings per share decrease by 28% last year. But over the longer term (5 years) earnings per share have increased by 10%.
Remember: P/E Ratios Don't Consider The Balance Sheet
The 'Price' in P/E reflects the market capitalization of the company. So it won't reflect the advantage of cash, or disadvantage of debt. Hypothetically, a company could reduce its future P/E ratio by spending its cash (or taking on debt) to achieve higher earnings.
While growth expenditure doesn't always pay off, the point is that it is a good option to have; but one that the P/E ratio ignores.
How Does Textron's Debt Impact Its P/E Ratio?
Textron has net debt equal to 37% of its market cap. While that's enough to warrant consideration, it doesn't really concern us.
The Bottom Line On Textron's P/E Ratio
Textron trades on a P/E ratio of 8.8, which is below the US market average of 15.1. The debt levels are not a major concern, but the lack of EPS growth is likely weighing on sentiment. What can be absolutely certain is that the market has become more pessimistic about Textron over the last month, with the P/E ratio falling from 14.4 back then to 8.8 today. For those who prefer to invest with the flow of momentum, that might be a bad sign, but for deep value investors this stock might justify some research.
Investors should be looking to buy stocks that the market is wrong about. As value investor Benjamin Graham famously said, 'In the short run, the market is a voting machine but in the long run, it is a weighing machine. So this free visual report on analyst forecasts could hold the key to an excellent investment decision.
Of course, you might find a fantastic investment by looking at a few good candidates. So take a peek at this free list of companies with modest (or no) debt, trading on a P/E below 20.
If you spot an error that warrants correction, please contact the editor at editorial-team@simplywallst.com. This article by Simply Wall St is general in nature. It does not constitute a recommendation to buy or sell any stock, and does not take account of your objectives, or your financial situation. Simply Wall St has no position in the stocks mentioned.
We aim to bring you long-term focused research analysis driven by fundamental data. Note that our analysis may not factor in the latest price-sensitive company announcements or qualitative material. Thank you for reading.
