
 Yahoo Finance
 How Does Tikkurila Oyj's (HEL:TIK1V) P/E Compare To Its Industry, After The Share Price Drop?

Unfortunately for some shareholders, the Tikkurila Oyj (HEL:TIK1V) share price has dived 30% in the last thirty days. Even longer term holders have taken a real hit with the stock declining 25% in the last year.
All else being equal, a share price drop should make a stock more attractive to potential investors. In the long term, share prices tend to follow earnings per share, but in the short term prices bounce around in response to short term factors (which are not always obvious). The implication here is that long term investors have an opportunity when expectations of a company are too low. Perhaps the simplest way to get a read on investors' expectations of a business is to look at its Price to Earnings Ratio (PE Ratio). A high P/E ratio means that investors have a high expectation about future growth, while a low P/E ratio means they have low expectations about future growth.
Check out our latest analysis for Tikkurila Oyj
How Does Tikkurila Oyj's P/E Ratio Compare To Its Peers?
We can tell from its P/E ratio of 14.62 that there is some investor optimism about Tikkurila Oyj. The image below shows that Tikkurila Oyj has a higher P/E than the average (13.1) P/E for companies in the chemicals industry.
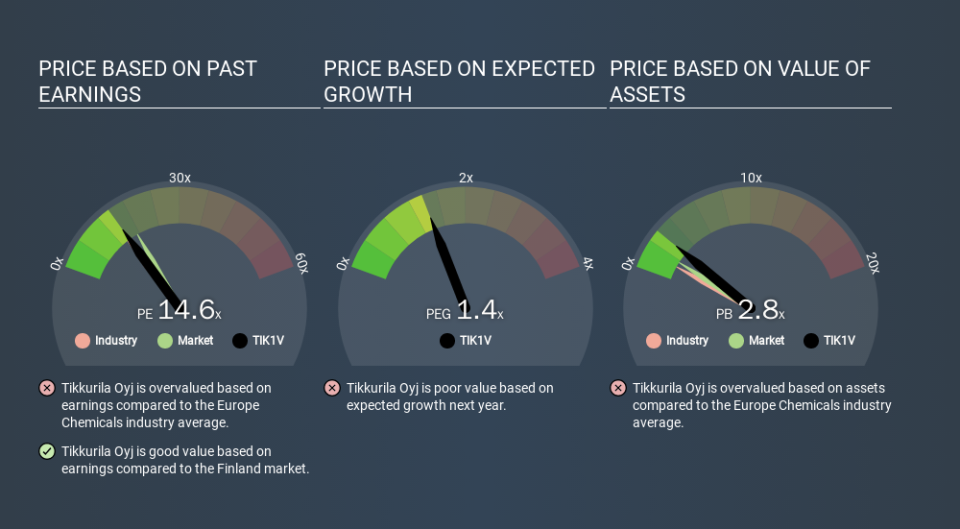
That means that the market expects Tikkurila Oyj will outperform other companies in its industry. The market is optimistic about the future, but that doesn't guarantee future growth. So further research is always essential. I often monitor director buying and selling.
How Growth Rates Impact P/E Ratios
Companies that shrink earnings per share quickly will rapidly decrease the 'E' in the equation. Therefore, even if you pay a low multiple of earnings now, that multiple will become higher in the future. So while a stock may look cheap based on past earnings, it could be expensive based on future earnings.
Tikkurila Oyj's 128% EPS improvement over the last year was like bamboo growth after rain; rapid and impressive. Regrettably, the longer term performance is poor, with EPS down 7.2% per year over 5 years.
Remember: P/E Ratios Don't Consider The Balance Sheet
Don't forget that the P/E ratio considers market capitalization. In other words, it does not consider any debt or cash that the company may have on the balance sheet. In theory, a company can lower its future P/E ratio by using cash or debt to invest in growth.
Such spending might be good or bad, overall, but the key point here is that you need to look at debt to understand the P/E ratio in context.
Tikkurila Oyj's Balance Sheet
Net debt totals 10% of Tikkurila Oyj's market cap. It would probably deserve a higher P/E ratio if it was net cash, since it would have more options for growth.
The Bottom Line On Tikkurila Oyj's P/E Ratio
Tikkurila Oyj has a P/E of 14.6. That's below the average in the FI market, which is 16.0. The EPS growth last year was strong, and debt levels are quite reasonable. The low P/E ratio suggests current market expectations are muted, implying these levels of growth will not continue. Because analysts are predicting more growth in the future, one might have expected to see a higher P/E ratio. You can take a closer look at the fundamentals, here. What can be absolutely certain is that the market has become significantly less optimistic about Tikkurila Oyj over the last month, with the P/E ratio falling from 21.0 back then to 14.6 today. For those who don't like to trade against momentum, that could be a warning sign, but a contrarian investor might want to take a closer look.
Investors have an opportunity when market expectations about a stock are wrong. If it is underestimating a company, investors can make money by buying and holding the shares until the market corrects itself. So this free visual report on analyst forecasts could hold the key to an excellent investment decision.
You might be able to find a better buy than Tikkurila Oyj. If you want a selection of possible winners, check out this free list of interesting companies that trade on a P/E below 20 (but have proven they can grow earnings).
If you spot an error that warrants correction, please contact the editor at editorial-team@simplywallst.com. This article by Simply Wall St is general in nature. It does not constitute a recommendation to buy or sell any stock, and does not take account of your objectives, or your financial situation. Simply Wall St has no position in the stocks mentioned.
We aim to bring you long-term focused research analysis driven by fundamental data. Note that our analysis may not factor in the latest price-sensitive company announcements or qualitative material. Thank you for reading.
