
 Yahoo Finance
 Does TKH Group's (AMS:TWEKA) Share Price Gain of 70% Match Its Business Performance?

Want to participate in a short research study? Help shape the future of investing tools and you could win a $250 gift card!
When we invest, we're generally looking for stocks that outperform the market average. Buying under-rated businesses is one path to excess returns. For example, long term TKH Group N.V. (AMS:TWEKA) shareholders have enjoyed a 70% share price rise over the last half decade, well in excess of the market return of around 26% (not including dividends).
Check out our latest analysis for TKH Group
To quote Buffett, 'Ships will sail around the world but the Flat Earth Society will flourish. There will continue to be wide discrepancies between price and value in the marketplace...' One flawed but reasonable way to assess how sentiment around a company has changed is to compare the earnings per share (EPS) with the share price.
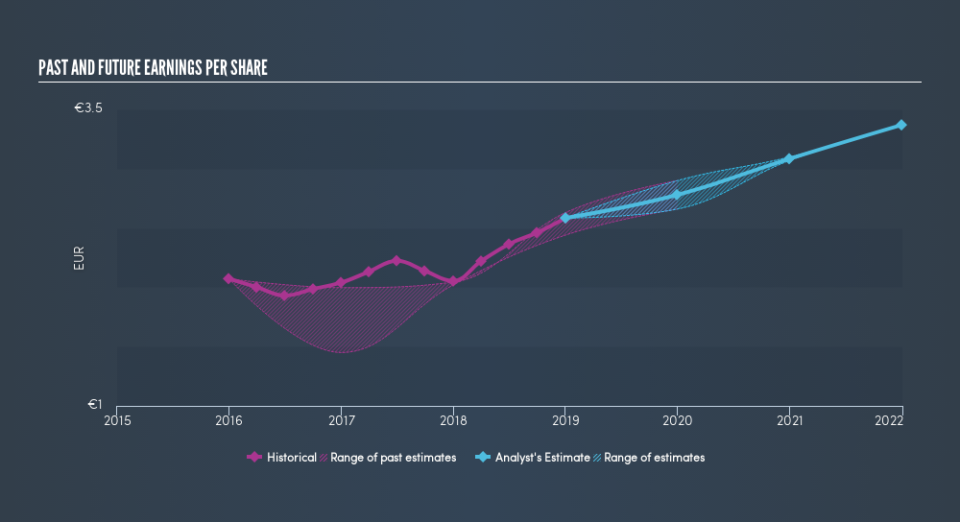
Over half a decade, TKH Group managed to grow its earnings per share at 21% a year. This EPS growth is higher than the 11% average annual increase in the share price. So it seems the market isn't so enthusiastic about the stock these days.
You can see how EPS has changed over time in the image below (click on the chart to see the exact values).
We know that TKH Group has improved its bottom line lately, but is it going to grow revenue? If you're interested, you could check this free report showing consensus revenue forecasts.
What About Dividends?
As well as measuring the share price return, investors should also consider the total shareholder return (TSR). Whereas the share price return only reflects the change in the share price, the TSR includes the value of dividends (assuming they were reinvested) and the benefit of any discounted capital raising or spin-off. So for companies that pay a generous dividend, the TSR is often a lot higher than the share price return. In the case of TKH Group, it has a TSR of 101% for the last 5 years. That exceeds its share price return that we previously mentioned. This is largely a result of its dividend payments!
A Different Perspective
TKH Group shareholders are down 20% for the year (even including dividends), but the market itself is up 3.5%. Even the share prices of good stocks drop sometimes, but we want to see improvements in the fundamental metrics of a business, before getting too interested. On the bright side, long term shareholders have made money, with a gain of 15% per year over half a decade. It could be that the recent sell-off is an opportunity, so it may be worth checking the fundamental data for signs of a long term growth trend. Keeping this in mind, a solid next step might be to take a look at TKH Group's dividend track record. This free interactive graph is a great place to start.
For those who like to find winning investments this free list of growing companies with recent insider purchasing, could be just the ticket.
Please note, the market returns quoted in this article reflect the market weighted average returns of stocks that currently trade on NL exchanges.
We aim to bring you long-term focused research analysis driven by fundamental data. Note that our analysis may not factor in the latest price-sensitive company announcements or qualitative material.
If you spot an error that warrants correction, please contact the editor at editorial-team@simplywallst.com. This article by Simply Wall St is general in nature. It does not constitute a recommendation to buy or sell any stock, and does not take account of your objectives, or your financial situation. Simply Wall St has no position in the stocks mentioned. Thank you for reading.
