
 Yahoo Finance
 Does Tomra Systems ASA's (OB:TOM) Debt Level Pose A Problem?

Stocks with market capitalization between $2B and $10B, such as Tomra Systems ASA (OB:TOM) with a size of øre41b, do not attract as much attention from the investing community as do the small-caps and large-caps. However, history shows that overlooked mid-cap companies have performed better on a risk-adjusted manner than the smaller and larger segment of the market. Let’s take a look at TOM’s debt concentration and assess their financial liquidity to get an idea of their ability to fund strategic acquisitions and grow through cyclical pressures. Remember this is a very top-level look that focuses exclusively on financial health, so I recommend a deeper analysis into TOM here.
View our latest analysis for Tomra Systems
TOM’s Debt (And Cash Flows)
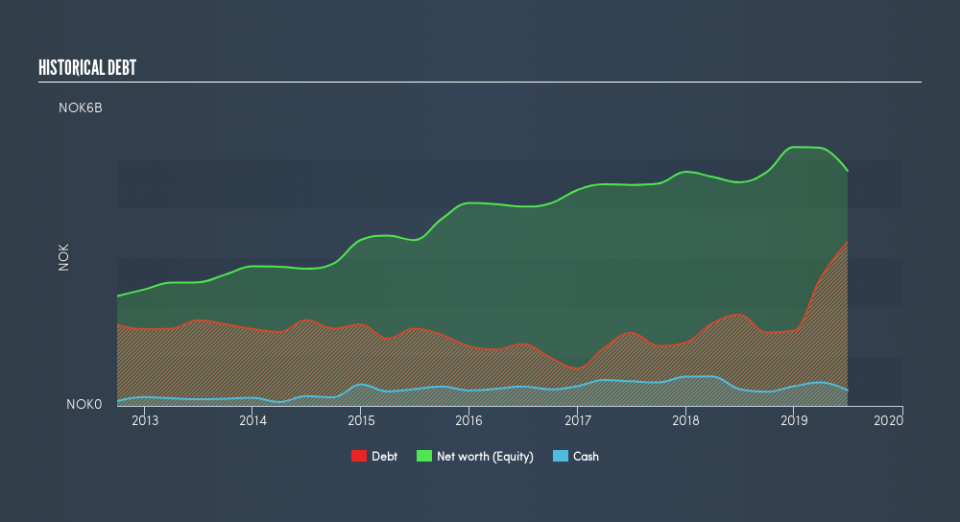
TOM has built up its total debt levels in the last twelve months, from øre1.8b to øre3.3b – this includes long-term debt. With this increase in debt, TOM currently has øre316m remaining in cash and short-term investments , ready to be used for running the business. On top of this, TOM has generated cash from operations of øre1.1b during the same period of time, resulting in an operating cash to total debt ratio of 32%, signalling that TOM’s current level of operating cash is high enough to cover debt.
Can TOM meet its short-term obligations with the cash in hand?
Looking at TOM’s øre1.4b in current liabilities, it seems that the business has been able to meet these obligations given the level of current assets of øre4.4b, with a current ratio of 3.06x. The current ratio is the number you get when you divide current assets by current liabilities. Having said that, many consider a ratio above 3x to be high, although this is not necessarily a bad thing.
Can TOM service its debt comfortably?
With a debt-to-equity ratio of 70%, TOM can be considered as an above-average leveraged company. This is not uncommon for a mid-cap company given that debt tends to be lower-cost and at times, more accessible. No matter how high the company’s debt, if it can easily cover the interest payments, it’s considered to be efficient with its use of excess leverage. A company generating earnings after interest and tax at least three times its net interest payments is considered financially sound. In TOM's case, the ratio of 28.8x suggests that interest is comfortably covered, which means that lenders may be inclined to lend more money to the company, as it is seen as safe in terms of payback.
Next Steps:
TOM’s high cash coverage means that, although its debt levels are high, the company is able to utilise its borrowings efficiently in order to generate cash flow. Since there is also no concerns around TOM's liquidity needs, this may be its optimal capital structure for the time being. Keep in mind I haven't considered other factors such as how TOM has been performing in the past. I suggest you continue to research Tomra Systems to get a more holistic view of the mid-cap by looking at:
Future Outlook: What are well-informed industry analysts predicting for TOM’s future growth? Take a look at our free research report of analyst consensus for TOM’s outlook.
Valuation: What is TOM worth today? Is the stock undervalued, even when its growth outlook is factored into its intrinsic value? The intrinsic value infographic in our free research report helps visualize whether TOM is currently mispriced by the market.
Other High-Performing Stocks: Are there other stocks that provide better prospects with proven track records? Explore our free list of these great stocks here.
We aim to bring you long-term focused research analysis driven by fundamental data. Note that our analysis may not factor in the latest price-sensitive company announcements or qualitative material.
If you spot an error that warrants correction, please contact the editor at editorial-team@simplywallst.com. This article by Simply Wall St is general in nature. It does not constitute a recommendation to buy or sell any stock, and does not take account of your objectives, or your financial situation. Simply Wall St has no position in the stocks mentioned. Thank you for reading.
