
 Yahoo Finance
 How Does Trans-Siberian Gold's (LON:TSG) P/E Compare To Its Industry, After The Share Price Drop?

To the annoyance of some shareholders, Trans-Siberian Gold (LON:TSG) shares are down a considerable 30% in the last month. If we look back over the last year, the stock has gained 96% which is great, even in a bull market.
Assuming nothing else has changed, a lower share price makes a stock more attractive to potential buyers. While the market sentiment towards a stock is very changeable, in the long run, the share price will tend to move in the same direction as earnings per share. The implication here is that long term investors have an opportunity when expectations of a company are too low. One way to gauge market expectations of a stock is to look at its Price to Earnings Ratio (PE Ratio). A high P/E ratio means that investors have a high expectation about future growth, while a low P/E ratio means they have low expectations about future growth.
View our latest analysis for Trans-Siberian Gold
How Does Trans-Siberian Gold's P/E Ratio Compare To Its Peers?
We can tell from its P/E ratio of 6.24 that sentiment around Trans-Siberian Gold isn't particularly high. We can see in the image below that the average P/E (9.2) for companies in the metals and mining industry is higher than Trans-Siberian Gold's P/E.
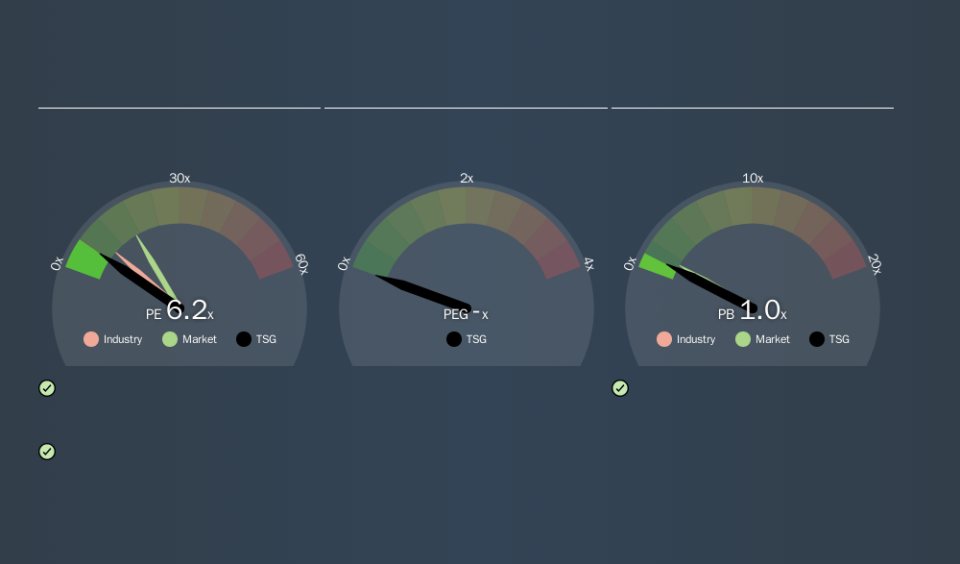
Trans-Siberian Gold's P/E tells us that market participants think it will not fare as well as its peers in the same industry. Since the market seems unimpressed with Trans-Siberian Gold, it's quite possible it could surprise on the upside. You should delve deeper. I like to check if company insiders have been buying or selling.
How Growth Rates Impact P/E Ratios
Generally speaking the rate of earnings growth has a profound impact on a company's P/E multiple. That's because companies that grow earnings per share quickly will rapidly increase the 'E' in the equation. And in that case, the P/E ratio itself will drop rather quickly. So while a stock may look expensive based on past earnings, it could be cheap based on future earnings.
In the last year, Trans-Siberian Gold grew EPS like Taylor Swift grew her fan base back in 2010; the 217% gain was both fast and well deserved. Even better, EPS is up 31% per year over three years. So we'd absolutely expect it to have a relatively high P/E ratio.
Don't Forget: The P/E Does Not Account For Debt or Bank Deposits
Don't forget that the P/E ratio considers market capitalization. In other words, it does not consider any debt or cash that the company may have on the balance sheet. The exact same company would hypothetically deserve a higher P/E ratio if it had a strong balance sheet, than if it had a weak one with lots of debt, because a cashed up company can spend on growth.
Such spending might be good or bad, overall, but the key point here is that you need to look at debt to understand the P/E ratio in context.
Trans-Siberian Gold's Balance Sheet
Trans-Siberian Gold has net debt worth 12% of its market capitalization. This could bring some additional risk, and reduce the number of investment options for management; worth remembering if you compare its P/E to businesses without debt.
The Verdict On Trans-Siberian Gold's P/E Ratio
Trans-Siberian Gold trades on a P/E ratio of 6.2, which is below the GB market average of 17.0. The company does have a little debt, and EPS growth was good last year. If it continues to grow, then the current low P/E may prove to be unjustified. Given Trans-Siberian Gold's P/E ratio has declined from 8.9 to 6.2 in the last month, we know for sure that the market is more worried about the business today, than it was back then. For those who prefer to invest with the flow of momentum, that might be a bad sign, but for deep value investors this stock might justify some research.
Investors should be looking to buy stocks that the market is wrong about. If the reality for a company is not as bad as the P/E ratio indicates, then the share price should increase as the market realizes this. Although we don't have analyst forecasts you could get a better understanding of its growth by checking out this more detailed historical graph of earnings, revenue and cash flow.
But note: Trans-Siberian Gold may not be the best stock to buy. So take a peek at this free list of interesting companies with strong recent earnings growth (and a P/E ratio below 20).
We aim to bring you long-term focused research analysis driven by fundamental data. Note that our analysis may not factor in the latest price-sensitive company announcements or qualitative material.
If you spot an error that warrants correction, please contact the editor at editorial-team@simplywallst.com. This article by Simply Wall St is general in nature. It does not constitute a recommendation to buy or sell any stock, and does not take account of your objectives, or your financial situation. Simply Wall St has no position in the stocks mentioned. Thank you for reading.
