
 Yahoo Finance
 How Does Tredegar Corporation (NYSE:TG) Affect Your Portfolio Volatility?

If you own shares in Tredegar Corporation (NYSE:TG) then it's worth thinking about how it contributes to the volatility of your portfolio, overall. In finance, Beta is a measure of volatility. Modern finance theory considers volatility to be a measure of risk, and there are two main types of price volatility. The first category is company specific volatility. This can be dealt with by limiting your exposure to any particular stock. The other type, which cannot be diversified away, is the volatility of the entire market. Every stock in the market is exposed to this volatility, which is linked to the fact that stocks prices are correlated in an efficient market.
Some stocks see their prices move in concert with the market. Others tend towards stronger, gentler or unrelated price movements. Beta is a widely used metric to measure a stock's exposure to market risk (volatility). Before we go on, it's worth noting that Warren Buffett pointed out in his 2014 letter to shareholders that 'volatility is far from synonymous with risk.' Having said that, beta can still be rather useful. The first thing to understand about beta is that the beta of the overall market is one. A stock with a beta below one is either less volatile than the market, or more volatile but not corellated with the overall market. In comparison a stock with a beta of over one tends to be move in a similar direction to the market in the long term, but with greater changes in price.
See our latest analysis for Tredegar
What TG's beta value tells investors
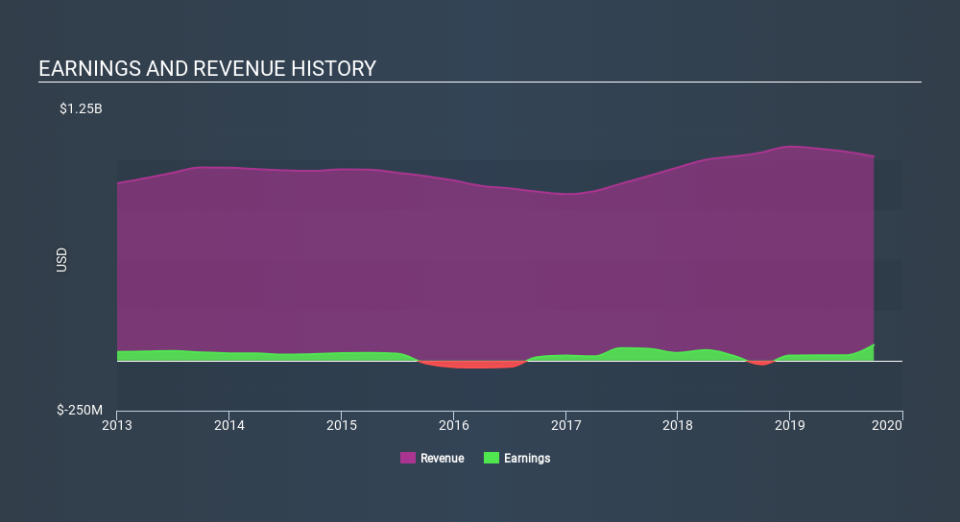
Tredegar has a five-year beta of 1.00. This is reasonably close to the market beta of 1, so the stock has in the past displayed similar levels of volatility to the overall market. If the future looks like the past, we could therefore consider it likely that the stock price will experience share price volatility that is roughly similar to the overall market. Share price volatility is well worth considering, but most long term investors consider the history of revenue and earnings growth to be more important. Take a look at how Tredegar fares in that regard, below.
How does TG's size impact its beta?
With a market capitalisation of US$720m, Tredegar is a small cap stock. However, it is big enough to catch the attention of professional investors. It takes less capital to move the share price of small companies, and they are also more impacted by company specific events, so it's a bit of a surprise that the beta is so close to the overall market.
What this means for you:
Tredegar has a beta value quite close to that of the overall market. That doesn't tell us much on its own, so it is probably worth considering whether the company is growing, if you're looking for stocks that will go up more than the overall market. This article aims to educate investors about beta values, but it's well worth looking at important company-specific fundamentals such as Tredegar’s financial health and performance track record. I urge you to continue your research by taking a look at the following:
Financial Health: Are TG’s operations financially sustainable? Balance sheets can be hard to analyze, which is why we’ve done it for you. Check out our financial health checks here.
Past Track Record: Has TG been consistently performing well irrespective of the ups and downs in the market? Go into more detail in the past performance analysis and take a look at the free visual representations of TG's historicals for more clarity.
Other High-Performing Stocks: Are there other stocks that provide better prospects with proven track records? Explore our free list of these great stocks here.
If you spot an error that warrants correction, please contact the editor at editorial-team@simplywallst.com. This article by Simply Wall St is general in nature. It does not constitute a recommendation to buy or sell any stock, and does not take account of your objectives, or your financial situation. Simply Wall St has no position in the stocks mentioned.
We aim to bring you long-term focused research analysis driven by fundamental data. Note that our analysis may not factor in the latest price-sensitive company announcements or qualitative material. Thank you for reading.
