
 Yahoo Finance
 Does Tronox Holdings (NYSE:TROX) Have A Healthy Balance Sheet?

Warren Buffett famously said, 'Volatility is far from synonymous with risk.' When we think about how risky a company is, we always like to look at its use of debt, since debt overload can lead to ruin. As with many other companies Tronox Holdings plc (NYSE:TROX) makes use of debt. But should shareholders be worried about its use of debt?
When Is Debt Dangerous?
Debt assists a business until the business has trouble paying it off, either with new capital or with free cash flow. If things get really bad, the lenders can take control of the business. However, a more usual (but still expensive) situation is where a company must dilute shareholders at a cheap share price simply to get debt under control. By replacing dilution, though, debt can be an extremely good tool for businesses that need capital to invest in growth at high rates of return. When we examine debt levels, we first consider both cash and debt levels, together.
See our latest analysis for Tronox Holdings
How Much Debt Does Tronox Holdings Carry?
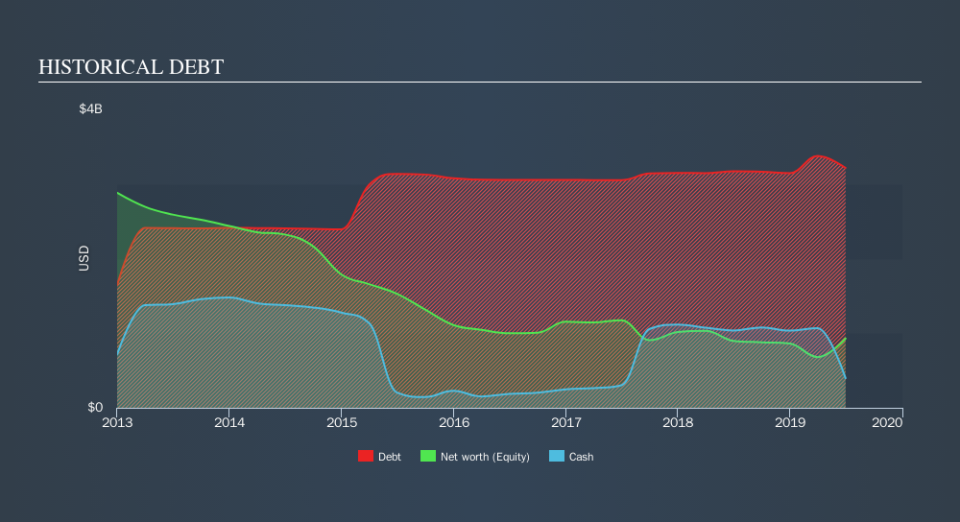
As you can see below, Tronox Holdings had US$3.22b of debt, at June 2019, which is about the same the year before. You can click the chart for greater detail. However, it also had US$397.0m in cash, and so its net debt is US$2.82b.
How Strong Is Tronox Holdings's Balance Sheet?
Zooming in on the latest balance sheet data, we can see that Tronox Holdings had liabilities of US$718.0m due within 12 months and liabilities of US$3.77b due beyond that. On the other hand, it had cash of US$397.0m and US$615.0m worth of receivables due within a year. So its liabilities outweigh the sum of its cash and (near-term) receivables by US$3.48b.
The deficiency here weighs heavily on the US$1.01b company itself, as if a child were struggling under the weight of an enormous back-pack full of books, his sports gear, and a trumpet." So we'd watch its balance sheet closely, without a doubt At the end of the day, Tronox Holdings would probably need a major re-capitalization if its creditors were to demand repayment.
We measure a company's debt load relative to its earnings power by looking at its net debt divided by its earnings before interest, tax, depreciation, and amortization (EBITDA) and by calculating how easily its earnings before interest and tax (EBIT) cover its interest expense (interest cover). The advantage of this approach is that we take into account both the absolute quantum of debt (with net debt to EBITDA) and the actual interest expenses associated with that debt (with its interest cover ratio).
Tronox Holdings shareholders face the double whammy of a high net debt to EBITDA ratio (5.9), and fairly weak interest coverage, since EBIT is just 1.5 times the interest expense. The debt burden here is substantial. Investors should also be troubled by the fact that Tronox Holdings saw its EBIT drop by 14% over the last twelve months. If things keep going like that, handling the debt will about as easy as bundling an angry house cat into its travel box. The balance sheet is clearly the area to focus on when you are analysing debt. But ultimately the future profitability of the business will decide if Tronox Holdings can strengthen its balance sheet over time. So if you want to see what the professionals think, you might find this free report on analyst profit forecasts to be interesting.
Finally, a company can only pay off debt with cold hard cash, not accounting profits. So the logical step is to look at the proportion of that EBIT that is matched by actual free cash flow. During the last three years, Tronox Holdings produced sturdy free cash flow equating to 66% of its EBIT, about what we'd expect. This cold hard cash means it can reduce its debt when it wants to.
Our View
On the face of it, Tronox Holdings's net debt to EBITDA left us tentative about the stock, and its level of total liabilities was no more enticing than the one empty restaurant on the busiest night of the year. But at least it's pretty decent at converting EBIT to free cash flow; that's encouraging. Taking into account all the aforementioned factors, it looks like Tronox Holdings has too much debt. While some investors love that sort of risky play, it's certainly not our cup of tea. Given the risks around Tronox Holdings's use of debt, the sensible thing to do is to check if insiders have been unloading the stock.
Of course, if you're the type of investor who prefers buying stocks without the burden of debt, then don't hesitate to discover our exclusive list of net cash growth stocks, today.
We aim to bring you long-term focused research analysis driven by fundamental data. Note that our analysis may not factor in the latest price-sensitive company announcements or qualitative material.
If you spot an error that warrants correction, please contact the editor at editorial-team@simplywallst.com. This article by Simply Wall St is general in nature. It does not constitute a recommendation to buy or sell any stock, and does not take account of your objectives, or your financial situation. Simply Wall St has no position in the stocks mentioned. Thank you for reading.
