
 Yahoo Finance
 Does UK Commercial Property REIT's (LON:UKCM) Share Price Gain of 19% Match Its Business Performance?
There's no doubt that investing in the stock market is a truly brilliant way to build wealth. But if you choose that path, you're going to buy some stocks that fall short of the market. For example, the UK Commercial Property REIT Limited (LON:UKCM), share price is up over the last year, but its gain of 19% trails the market return. On the other hand, longer term shareholders have had a tougher run, with the stock falling 7.1% in three years.
View our latest analysis for UK Commercial Property REIT
While markets are a powerful pricing mechanism, share prices reflect investor sentiment, not just underlying business performance. One flawed but reasonable way to assess how sentiment around a company has changed is to compare the earnings per share (EPS) with the share price.
During the last year UK Commercial Property REIT saw its earnings per share (EPS) drop below zero. While this may prove temporary, we'd consider it a negative, so we would not have expected to see the share price up. We might get a clue to explain the share price move by looking to other metrics.
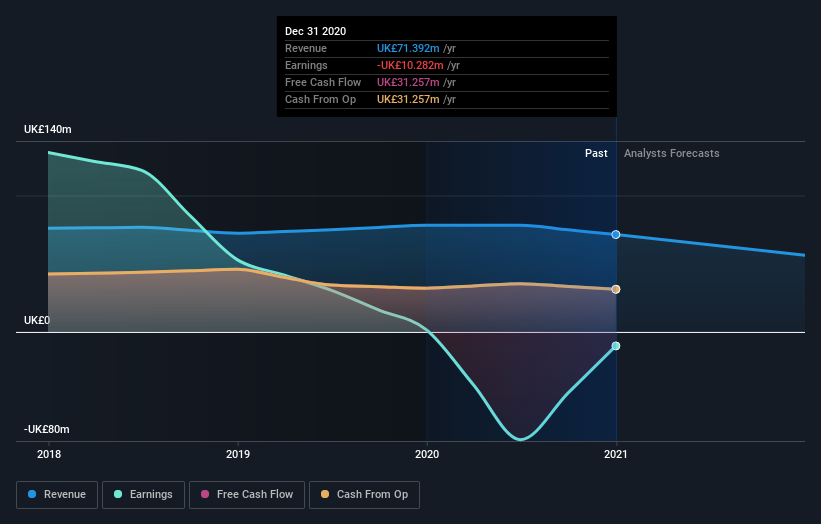
UK Commercial Property REIT's revenue actually dropped 8.7% over last year. So using a snapshot of key business metrics doesn't give us a good picture of why the market is bidding up the stock.
The company's revenue and earnings (over time) are depicted in the image below (click to see the exact numbers).
This free interactive report on UK Commercial Property REIT's balance sheet strength is a great place to start, if you want to investigate the stock further.
What About Dividends?
It is important to consider the total shareholder return, as well as the share price return, for any given stock. The TSR is a return calculation that accounts for the value of cash dividends (assuming that any dividend received was reinvested) and the calculated value of any discounted capital raisings and spin-offs. Arguably, the TSR gives a more comprehensive picture of the return generated by a stock. In the case of UK Commercial Property REIT, it has a TSR of 23% for the last year. That exceeds its share price return that we previously mentioned. The dividends paid by the company have thusly boosted the total shareholder return.
A Different Perspective
UK Commercial Property REIT shareholders gained a total return of 23% during the year. But that was short of the market average. On the bright side, that's still a gain, and it's actually better than the average return of 5% over half a decade This suggests the company might be improving over time. It's always interesting to track share price performance over the longer term. But to understand UK Commercial Property REIT better, we need to consider many other factors. For instance, we've identified 2 warning signs for UK Commercial Property REIT (1 can't be ignored) that you should be aware of.
If you like to buy stocks alongside management, then you might just love this free list of companies. (Hint: insiders have been buying them).
Please note, the market returns quoted in this article reflect the market weighted average returns of stocks that currently trade on GB exchanges.
This article by Simply Wall St is general in nature. It does not constitute a recommendation to buy or sell any stock, and does not take account of your objectives, or your financial situation. We aim to bring you long-term focused analysis driven by fundamental data. Note that our analysis may not factor in the latest price-sensitive company announcements or qualitative material. Simply Wall St has no position in any stocks mentioned.
Have feedback on this article? Concerned about the content? Get in touch with us directly. Alternatively, email editorial-team (at) simplywallst.com.
