
 Yahoo Finance
 Does This Valuation Of ForFarmers N.V. (AMS:FFARM) Imply Investors Are Overpaying?
Key Insights
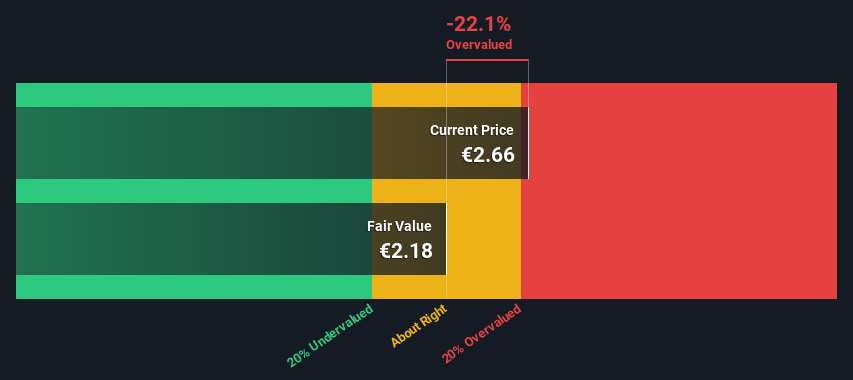
Using the Dividend Discount Model, ForFarmers fair value estimate is €2.18
ForFarmers is estimated to be 22% overvalued based on current share price of €2.66
ForFarmers' peers are currently trading at a discount of 35% on average
Does the April share price for ForFarmers N.V. (AMS:FFARM) reflect what it's really worth? Today, we will estimate the stock's intrinsic value by taking the forecast future cash flows of the company and discounting them back to today's value. We will use the Discounted Cash Flow (DCF) model on this occasion. It may sound complicated, but actually it is quite simple!
Remember though, that there are many ways to estimate a company's value, and a DCF is just one method. If you want to learn more about discounted cash flow, the rationale behind this calculation can be read in detail in the Simply Wall St analysis model.
View our latest analysis for ForFarmers
The Method
As ForFarmers operates in the food sector, we need to calculate the intrinsic value slightly differently. Instead of using free cash flows, which are hard to estimate and often not reported by analysts in this industry, dividends per share (DPS) payments are used. Unless a company pays out the majority of its FCF as a dividend, this method will typically underestimate the value of the stock. We use the Gordon Growth Model, which assumes dividend will grow into perpetuity at a rate that can be sustained. For a number of reasons a very conservative growth rate is used that cannot exceed that of a company's Gross Domestic Product (GDP). In this case we used the 5-year average of the 10-year government bond yield (0.8%). The expected dividend per share is then discounted to today's value at a cost of equity of 4.4%. Compared to the current share price of €2.7, the company appears slightly overvalued at the time of writing. The assumptions in any calculation have a big impact on the valuation, so it is better to view this as a rough estimate, not precise down to the last cent.
Value Per Share = Expected Dividend Per Share / (Discount Rate - Perpetual Growth Rate)
= €0.1 / (4.4% – 0.8%)
= €2.2
Important Assumptions
We would point out that the most important inputs to a discounted cash flow are the discount rate and of course the actual cash flows. Part of investing is coming up with your own evaluation of a company's future performance, so try the calculation yourself and check your own assumptions. The DCF also does not consider the possible cyclicality of an industry, or a company's future capital requirements, so it does not give a full picture of a company's potential performance. Given that we are looking at ForFarmers as potential shareholders, the cost of equity is used as the discount rate, rather than the cost of capital (or weighted average cost of capital, WACC) which accounts for debt. In this calculation we've used 4.4%, which is based on a levered beta of 0.800. Beta is a measure of a stock's volatility, compared to the market as a whole. We get our beta from the industry average beta of globally comparable companies, with an imposed limit between 0.8 and 2.0, which is a reasonable range for a stable business.
SWOT Analysis for ForFarmers
Strength
Debt is well covered by cash flow.
Dividend is in the top 25% of dividend payers in the market.
Weakness
Interest payments on debt are not well covered.
Opportunity
Expected to breakeven next year.
Has sufficient cash runway for more than 3 years based on current free cash flows.
Good value based on P/S ratio compared to estimated Fair P/S ratio.
Significant insider buying over the past 3 months.
Threat
Paying a dividend but company is unprofitable.
Next Steps:
Although the valuation of a company is important, it ideally won't be the sole piece of analysis you scrutinize for a company. DCF models are not the be-all and end-all of investment valuation. Rather it should be seen as a guide to "what assumptions need to be true for this stock to be under/overvalued?" For instance, if the terminal value growth rate is adjusted slightly, it can dramatically alter the overall result. What is the reason for the share price exceeding the intrinsic value? For ForFarmers, there are three pertinent items you should explore:
Risks: Every company has them, and we've spotted 1 warning sign for ForFarmers you should know about.
Future Earnings: How does FFARM's growth rate compare to its peers and the wider market? Dig deeper into the analyst consensus number for the upcoming years by interacting with our free analyst growth expectation chart.
Other High Quality Alternatives: Do you like a good all-rounder? Explore our interactive list of high quality stocks to get an idea of what else is out there you may be missing!
PS. The Simply Wall St app conducts a discounted cash flow valuation for every stock on the ENXTAM every day. If you want to find the calculation for other stocks just search here.
Have feedback on this article? Concerned about the content? Get in touch with us directly. Alternatively, email editorial-team (at) simplywallst.com.
This article by Simply Wall St is general in nature. We provide commentary based on historical data and analyst forecasts only using an unbiased methodology and our articles are not intended to be financial advice. It does not constitute a recommendation to buy or sell any stock, and does not take account of your objectives, or your financial situation. We aim to bring you long-term focused analysis driven by fundamental data. Note that our analysis may not factor in the latest price-sensitive company announcements or qualitative material. Simply Wall St has no position in any stocks mentioned.
