
 Yahoo Finance
 Does Vonovia SE (ETR:VNA) Have A Good P/E Ratio?

The goal of this article is to teach you how to use price to earnings ratios (P/E ratios). We’ll show how you can use Vonovia SE’s (ETR:VNA) P/E ratio to inform your assessment of the investment opportunity. Vonovia has a P/E ratio of 7.72, based on the last twelve months. That means that at current prices, buyers pay €7.72 for every €1 in trailing yearly profits.
See our latest analysis for Vonovia
How Do You Calculate Vonovia’s P/E Ratio?
The formula for P/E is:
Price to Earnings Ratio = Share Price ÷ Earnings per Share (EPS)
Or for Vonovia:
P/E of 7.72 = €40.64 ÷ €5.26 (Based on the trailing twelve months to September 2018.)
Is A High Price-to-Earnings Ratio Good?
A higher P/E ratio means that investors are paying a higher price for each €1 of company earnings. That isn’t a good or a bad thing on its own, but a high P/E means that buyers have a higher opinion of the business’s prospects, relative to stocks with a lower P/E.
How Growth Rates Impact P/E Ratios
P/E ratios primarily reflect market expectations around earnings growth rates. That’s because companies that grow earnings per share quickly will rapidly increase the ‘E’ in the equation. That means even if the current P/E is high, it will reduce over time if the share price stays flat. A lower P/E should indicate the stock is cheap relative to others — and that may attract buyers.
Vonovia’s earnings per share fell by 24% in the last twelve months. But over the longer term (5 years) earnings per share have increased by 37%.
How Does Vonovia’s P/E Ratio Compare To Its Peers?
The P/E ratio indicates whether the market has higher or lower expectations of a company. If you look at the image below, you can see Vonovia has a lower P/E than the average (11.6) in the real estate industry classification.
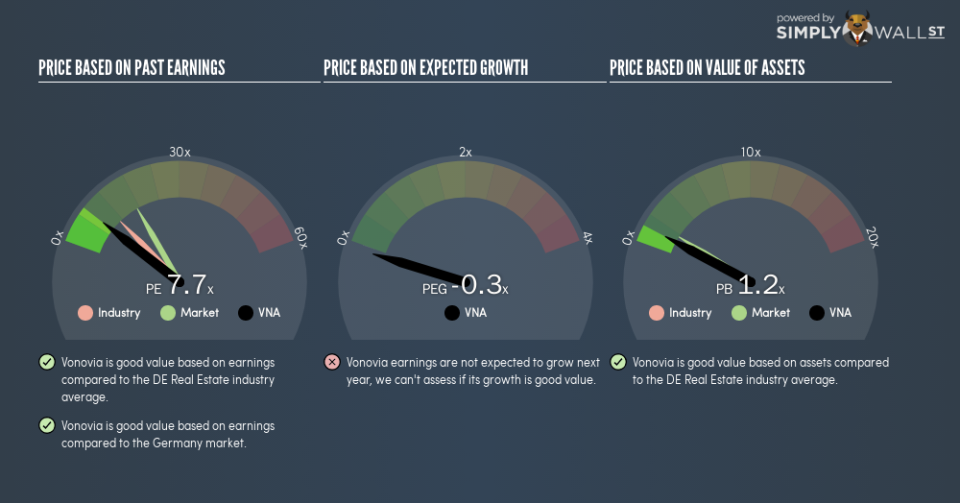
This suggests that market participants think Vonovia will underperform other companies in its industry. Since the market seems unimpressed with Vonovia, it’s quite possible it could surprise on the upside. If you consider the stock interesting, further research is recommended. For example, I often monitor director buying and selling.
Don’t Forget: The P/E Does Not Account For Debt or Bank Deposits
The ‘Price’ in P/E reflects the market capitalization of the company. In other words, it does not consider any debt or cash that the company may have on the balance sheet. In theory, a company can lower its future P/E ratio by using cash or debt to invest in growth.
Spending on growth might be good or bad a few years later, but the point is that the P/E ratio does not account for the option (or lack thereof).
Vonovia’s Balance Sheet
Vonovia’s net debt is 95% of its market cap. This is a reasonably significant level of debt — all else being equal you’d expect a much lower P/E than if it had net cash.
The Bottom Line On Vonovia’s P/E Ratio
Vonovia has a P/E of 7.7. That’s below the average in the DE market, which is 17.2. The P/E reflects market pessimism that probably arises from the lack of recent EPS growth, paired with significant leverage.
When the market is wrong about a stock, it gives savvy investors an opportunity. If the reality for a company is not as bad as the P/E ratio indicates, then the share price should increase as the market realizes this. So this free visualization of the analyst consensus on future earnings could help you make the right decision about whether to buy, sell, or hold.
But note: Vonovia may not be the best stock to buy. So take a peek at this free list of interesting companies with strong recent earnings growth (and a P/E ratio below 20).
To help readers see past the short term volatility of the financial market, we aim to bring you a long-term focused research analysis purely driven by fundamental data. Note that our analysis does not factor in the latest price-sensitive company announcements.
The author is an independent contributor and at the time of publication had no position in the stocks mentioned. For errors that warrant correction please contact the editor at editorial-team@simplywallst.com.
