
 Yahoo Finance
 What Does WPP plc’s (LON:WPP) 8.2% ROCE Say About The Business?

Want to participate in a short research study? Help shape the future of investing tools and you could win a $250 gift card!
Today we are going to look at WPP plc (LON:WPP) to see whether it might be an attractive investment prospect. Specifically, we're going to calculate its Return On Capital Employed (ROCE), in the hopes of getting some insight into the business.
First of all, we'll work out how to calculate ROCE. Then we'll compare its ROCE to similar companies. Then we'll determine how its current liabilities are affecting its ROCE.
Understanding Return On Capital Employed (ROCE)
ROCE measures the 'return' (pre-tax profit) a company generates from capital employed in its business. Generally speaking a higher ROCE is better. Overall, it is a valuable metric that has its flaws. Author Edwin Whiting says to be careful when comparing the ROCE of different businesses, since 'No two businesses are exactly alike.'
How Do You Calculate Return On Capital Employed?
Analysts use this formula to calculate return on capital employed:
Return on Capital Employed = Earnings Before Interest and Tax (EBIT) ÷ (Total Assets - Current Liabilities)
Or for WPP:
0.082 = UK£1.4b ÷ (UK£34b - UK£17b) (Based on the trailing twelve months to December 2018.)
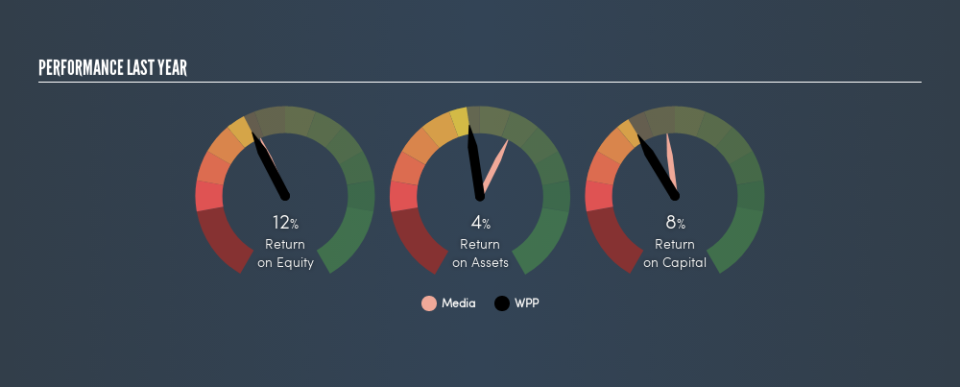
Therefore, WPP has an ROCE of 8.2%.
Check out our latest analysis for WPP
Does WPP Have A Good ROCE?
ROCE is commonly used for comparing the performance of similar businesses. Using our data, WPP's ROCE appears to be around the 9.2% average of the Media industry. Aside from the industry comparison, WPP's ROCE is mediocre in absolute terms, considering the risk of investing in stocks versus the safety of a bank account. It is possible that there are more rewarding investments out there.
As we can see, WPP currently has an ROCE of 8.2%, less than the 11% it reported 3 years ago. Therefore we wonder if the company is facing new headwinds.
When considering this metric, keep in mind that it is backwards looking, and not necessarily predictive. ROCE can be misleading for companies in cyclical industries, with returns looking impressive during the boom times, but very weak during the busts. ROCE is only a point-in-time measure. Future performance is what matters, and you can see analyst predictions in our free report on analyst forecasts for the company.
How WPP's Current Liabilities Impact Its ROCE
Liabilities, such as supplier bills and bank overdrafts, are referred to as current liabilities if they need to be paid within 12 months. Due to the way the ROCE equation works, having large bills due in the near term can make it look as though a company has less capital employed, and thus a higher ROCE than usual. To counter this, investors can check if a company has high current liabilities relative to total assets.
WPP has total assets of UK£34b and current liabilities of UK£17b. As a result, its current liabilities are equal to approximately 49% of its total assets. WPP's middling level of current liabilities have the effect of boosting its ROCE a bit.
What We Can Learn From WPP's ROCE
With this level of liabilities and a mediocre ROCE, there are potentially better investments out there. Of course, you might also be able to find a better stock than WPP. So you may wish to see this free collection of other companies that have grown earnings strongly.
If you like to buy stocks alongside management, then you might just love this free list of companies. (Hint: insiders have been buying them).
We aim to bring you long-term focused research analysis driven by fundamental data. Note that our analysis may not factor in the latest price-sensitive company announcements or qualitative material.
If you spot an error that warrants correction, please contact the editor at editorial-team@simplywallst.com. This article by Simply Wall St is general in nature. It does not constitute a recommendation to buy or sell any stock, and does not take account of your objectives, or your financial situation. Simply Wall St has no position in the stocks mentioned. Thank you for reading.
