
 Yahoo Finance
 Does Zogenix's (NASDAQ:ZGNX) CEO Salary Compare Well With The Performance Of The Company?

Steve Farr has been the CEO of Zogenix, Inc. (NASDAQ:ZGNX) since 2015, and this article will examine the executive's compensation with respect to the overall performance of the company. This analysis will also assess whether Zogenix pays its CEO appropriately, considering recent earnings growth and total shareholder returns.
View our latest analysis for Zogenix
Comparing Zogenix, Inc.'s CEO Compensation With the industry
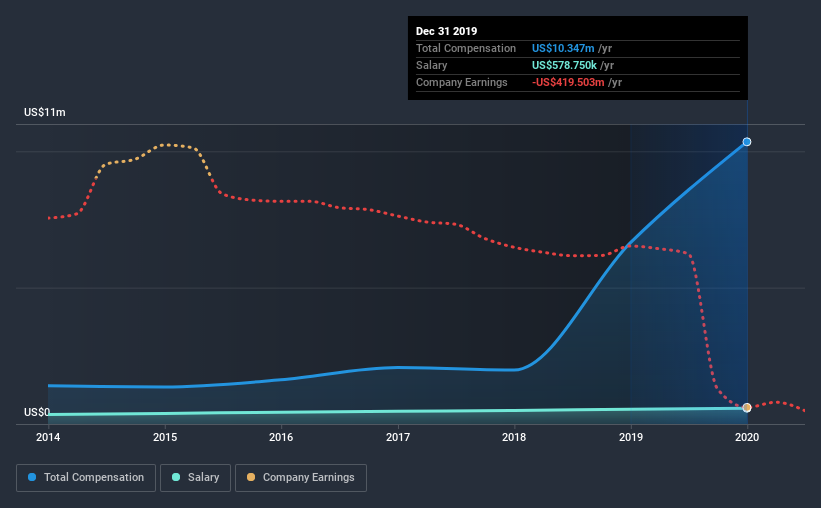
According to our data, Zogenix, Inc. has a market capitalization of US$1.4b, and paid its CEO total annual compensation worth US$10m over the year to December 2019. Notably, that's an increase of 56% over the year before. While this analysis focuses on total compensation, it's worth acknowledging that the salary portion is lower, valued at US$579k.
On examining similar-sized companies in the industry with market capitalizations between US$1.0b and US$3.2b, we discovered that the median CEO total compensation of that group was US$5.1m. This suggests that Steve Farr is paid more than the median for the industry. Moreover, Steve Farr also holds US$2.0m worth of Zogenix stock directly under their own name, which reveals to us that they have a significant personal stake in the company.
Component | 2019 | 2018 | Proportion (2019) |
Salary | US$579k | US$545k | 6% |
Other | US$9.8m | US$6.1m | 94% |
Total Compensation | US$10m | US$6.7m | 100% |
Talking in terms of the industry, salary represented approximately 24% of total compensation out of all the companies we analyzed, while other remuneration made up 76% of the pie. Zogenix pays a modest slice of remuneration through salary, as compared to the broader industry. It's important to note that a slant towards non-salary compensation suggests that total pay is tied to the company's performance.
Zogenix, Inc.'s Growth
Over the last three years, Zogenix, Inc. has shrunk its earnings per share by 35% per year. It achieved revenue growth of 352% over the last year.
The decrease in EPS could be a concern for some investors. But in contrast the revenue growth is strong, suggesting future potential for EPS growth. In conclusion we can't form a strong opinion about business performance yet; but it's one worth watching. Looking ahead, you might want to check this free visual report on analyst forecasts for the company's future earnings..
Has Zogenix, Inc. Been A Good Investment?
Most shareholders would probably be pleased with Zogenix, Inc. for providing a total return of 71% over three years. So they may not be at all concerned if the CEO were to be paid more than is normal for companies around the same size.
In Summary...
As we touched on above, Zogenix, Inc. is currently paying its CEO higher than the median pay for CEOs of companies belonging to the same industry and with similar market capitalizations. But shareholder returns and revenue growth have been very healthy as we saw before. Importantly though, EPS has not been growing over the same stretch. Although we would have liked to see EPS growth, positive shareholder returns, and growing revenues make us believe CEO compensation is reasonable.
While CEO pay is an important factor to be aware of, there are other areas that investors should be mindful of as well. We did our research and spotted 3 warning signs for Zogenix that investors should look into moving forward.
Arguably, business quality is much more important than CEO compensation levels. So check out this free list of interesting companies that have HIGH return on equity and low debt.
This article by Simply Wall St is general in nature. It does not constitute a recommendation to buy or sell any stock, and does not take account of your objectives, or your financial situation. We aim to bring you long-term focused analysis driven by fundamental data. Note that our analysis may not factor in the latest price-sensitive company announcements or qualitative material. Simply Wall St has no position in any stocks mentioned.
Have feedback on this article? Concerned about the content? Get in touch with us directly. Alternatively, email editorial-team@simplywallst.com.
