
 Yahoo Finance
 Don’t Buy Enbridge Inc. (TSE:ENB) Until You Understand Its ROCE

Today we'll look at Enbridge Inc. (TSE:ENB) and reflect on its potential as an investment. Specifically, we'll consider its Return On Capital Employed (ROCE), since that will give us an insight into how efficiently the business can generate profits from the capital it requires.
First up, we'll look at what ROCE is and how we calculate it. Second, we'll look at its ROCE compared to similar companies. And finally, we'll look at how its current liabilities are impacting its ROCE.
What is Return On Capital Employed (ROCE)?
ROCE is a metric for evaluating how much pre-tax income (in percentage terms) a company earns on the capital invested in its business. Generally speaking a higher ROCE is better. Overall, it is a valuable metric that has its flaws. Renowned investment researcher Michael Mauboussin has suggested that a high ROCE can indicate that 'one dollar invested in the company generates value of more than one dollar'.
How Do You Calculate Return On Capital Employed?
Analysts use this formula to calculate return on capital employed:
Return on Capital Employed = Earnings Before Interest and Tax (EBIT) ÷ (Total Assets - Current Liabilities)
Or for Enbridge:
0.054 = CA$8.2b ÷ (CA$167b - CA$14b) (Based on the trailing twelve months to September 2019.)
Therefore, Enbridge has an ROCE of 5.4%.
See our latest analysis for Enbridge
Does Enbridge Have A Good ROCE?
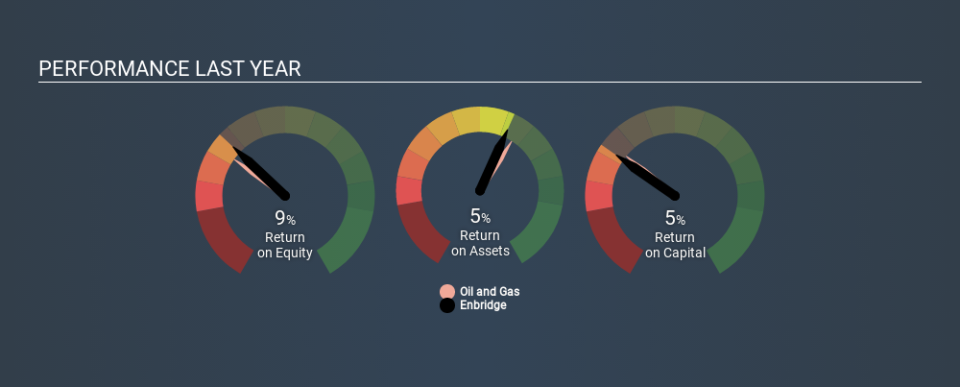
ROCE is commonly used for comparing the performance of similar businesses. It appears that Enbridge's ROCE is fairly close to the Oil and Gas industry average of 5.4%. Aside from the industry comparison, Enbridge's ROCE is mediocre in absolute terms, considering the risk of investing in stocks versus the safety of a bank account. It is possible that there are more rewarding investments out there.
You can see in the image below how Enbridge's ROCE compares to its industry. Click to see more on past growth.
When considering this metric, keep in mind that it is backwards looking, and not necessarily predictive. ROCE can be misleading for companies in cyclical industries, with returns looking impressive during the boom times, but very weak during the busts. ROCE is, after all, simply a snap shot of a single year. We note Enbridge could be considered a cyclical business. Since the future is so important for investors, you should check out our free report on analyst forecasts for Enbridge.
Do Enbridge's Current Liabilities Skew Its ROCE?
Current liabilities include invoices, such as supplier payments, short-term debt, or a tax bill, that need to be paid within 12 months. Due to the way ROCE is calculated, a high level of current liabilities makes a company look as though it has less capital employed, and thus can (sometimes unfairly) boost the ROCE. To check the impact of this, we calculate if a company has high current liabilities relative to its total assets.
Enbridge has total assets of CA$167b and current liabilities of CA$14b. Therefore its current liabilities are equivalent to approximately 8.1% of its total assets. With low levels of current liabilities, at least Enbridge's mediocre ROCE is not unduly boosted.
Our Take On Enbridge's ROCE
If performance improves, then Enbridge may be an OK investment, especially at the right valuation. You might be able to find a better investment than Enbridge. If you want a selection of possible winners, check out this free list of interesting companies that trade on a P/E below 20 (but have proven they can grow earnings).
If you like to buy stocks alongside management, then you might just love this free list of companies. (Hint: insiders have been buying them).
If you spot an error that warrants correction, please contact the editor at editorial-team@simplywallst.com. This article by Simply Wall St is general in nature. It does not constitute a recommendation to buy or sell any stock, and does not take account of your objectives, or your financial situation. Simply Wall St has no position in the stocks mentioned.
We aim to bring you long-term focused research analysis driven by fundamental data. Note that our analysis may not factor in the latest price-sensitive company announcements or qualitative material. Thank you for reading.
