
 Yahoo Finance
 Donaco International (ASX:DNA) Has Some Difficulty Using Its Capital Effectively
Ignoring the stock price of a company, what are the underlying trends that tell us a business is past the growth phase? A business that's potentially in decline often shows two trends, a return on capital employed (ROCE) that's declining, and a base of capital employed that's also declining. Trends like this ultimately mean the business is reducing its investments and also earning less on what it has invested. So after glancing at the trends within Donaco International (ASX:DNA), we weren't too hopeful.
Understanding Return On Capital Employed (ROCE)
Just to clarify if you're unsure, ROCE is a metric for evaluating how much pre-tax income (in percentage terms) a company earns on the capital invested in its business. Analysts use this formula to calculate it for Donaco International:
Return on Capital Employed = Earnings Before Interest and Tax (EBIT) ÷ (Total Assets - Current Liabilities)
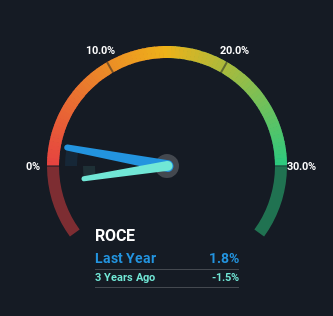
0.018 = AU$2.3m ÷ (AU$182m - AU$52m) (Based on the trailing twelve months to June 2023).
So, Donaco International has an ROCE of 1.8%. Ultimately, that's a low return and it under-performs the Hospitality industry average of 6.2%.
Check out our latest analysis for Donaco International
While the past is not representative of the future, it can be helpful to know how a company has performed historically, which is why we have this chart above. If you're interested in investigating Donaco International's past further, check out this free graph of past earnings, revenue and cash flow.
So How Is Donaco International's ROCE Trending?
The trend of returns that Donaco International is generating are raising some concerns. The company used to generate 7.8% on its capital five years ago but it has since fallen noticeably. In addition to that, Donaco International is now employing 69% less capital than it was five years ago. When you see both ROCE and capital employed diminishing, it can often be a sign of a mature and shrinking business that might be in structural decline. Typically businesses that exhibit these characteristics aren't the ones that tend to multiply over the long term, because statistically speaking, they've already gone through the growth phase of their life cycle.
While on the subject, we noticed that the ratio of current liabilities to total assets has risen to 29%, which has impacted the ROCE. Without this increase, it's likely that ROCE would be even lower than 1.8%. While the ratio isn't currently too high, it's worth keeping an eye on this because if it gets particularly high, the business could then face some new elements of risk.
The Bottom Line On Donaco International's ROCE
In summary, it's unfortunate that Donaco International is shrinking its capital base and also generating lower returns. We expect this has contributed to the stock plummeting 81% during the last five years. That being the case, unless the underlying trends revert to a more positive trajectory, we'd consider looking elsewhere.
One more thing, we've spotted 2 warning signs facing Donaco International that you might find interesting.
For those who like to invest in solid companies, check out this free list of companies with solid balance sheets and high returns on equity.
Have feedback on this article? Concerned about the content? Get in touch with us directly. Alternatively, email editorial-team (at) simplywallst.com.
This article by Simply Wall St is general in nature. We provide commentary based on historical data and analyst forecasts only using an unbiased methodology and our articles are not intended to be financial advice. It does not constitute a recommendation to buy or sell any stock, and does not take account of your objectives, or your financial situation. We aim to bring you long-term focused analysis driven by fundamental data. Note that our analysis may not factor in the latest price-sensitive company announcements or qualitative material. Simply Wall St has no position in any stocks mentioned.
