
 Yahoo Finance
 Donaco International's (ASX:DNA) Returns On Capital Are Heading Higher
If you're looking for a multi-bagger, there's a few things to keep an eye out for. Firstly, we'll want to see a proven return on capital employed (ROCE) that is increasing, and secondly, an expanding base of capital employed. Put simply, these types of businesses are compounding machines, meaning they are continually reinvesting their earnings at ever-higher rates of return. So when we looked at Donaco International (ASX:DNA) and its trend of ROCE, we really liked what we saw.
What Is Return On Capital Employed (ROCE)?
For those that aren't sure what ROCE is, it measures the amount of pre-tax profits a company can generate from the capital employed in its business. The formula for this calculation on Donaco International is:
Return on Capital Employed = Earnings Before Interest and Tax (EBIT) ÷ (Total Assets - Current Liabilities)
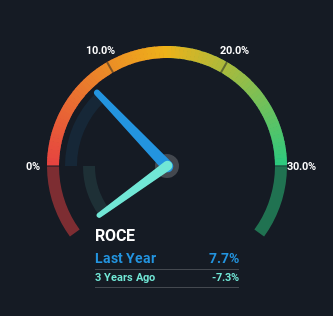
0.077 = AU$10m ÷ (AU$183m - AU$51m) (Based on the trailing twelve months to December 2023).
Thus, Donaco International has an ROCE of 7.7%. Even though it's in line with the industry average of 8.2%, it's still a low return by itself.
Check out our latest analysis for Donaco International
While the past is not representative of the future, it can be helpful to know how a company has performed historically, which is why we have this chart above. If you want to delve into the historical earnings , check out these free graphs detailing revenue and cash flow performance of Donaco International.
The Trend Of ROCE
You'd find it hard not to be impressed with the ROCE trend at Donaco International. The data shows that returns on capital have increased by 21% over the trailing five years. The company is now earning AU$0.08 per dollar of capital employed. In regards to capital employed, Donaco International appears to been achieving more with less, since the business is using 66% less capital to run its operation. Donaco International may be selling some assets so it's worth investigating if the business has plans for future investments to increase returns further still.
For the record though, there was a noticeable increase in the company's current liabilities over the period, so we would attribute some of the ROCE growth to that. Effectively this means that suppliers or short-term creditors are now funding 28% of the business, which is more than it was five years ago. Keep an eye out for future increases because when the ratio of current liabilities to total assets gets particularly high, this can introduce some new risks for the business.
The Key Takeaway
In summary, it's great to see that Donaco International has been able to turn things around and earn higher returns on lower amounts of capital. Astute investors may have an opportunity here because the stock has declined 60% in the last five years. So researching this company further and determining whether or not these trends will continue seems justified.
Donaco International does come with some risks though, we found 2 warning signs in our investment analysis, and 1 of those makes us a bit uncomfortable...
While Donaco International isn't earning the highest return, check out this free list of companies that are earning high returns on equity with solid balance sheets.
Have feedback on this article? Concerned about the content? Get in touch with us directly. Alternatively, email editorial-team (at) simplywallst.com.
This article by Simply Wall St is general in nature. We provide commentary based on historical data and analyst forecasts only using an unbiased methodology and our articles are not intended to be financial advice. It does not constitute a recommendation to buy or sell any stock, and does not take account of your objectives, or your financial situation. We aim to bring you long-term focused analysis driven by fundamental data. Note that our analysis may not factor in the latest price-sensitive company announcements or qualitative material. Simply Wall St has no position in any stocks mentioned.
