
 Yahoo Finance
 Don't Sell A.G. BARR p.l.c. (LON:BAG) Before You Read This

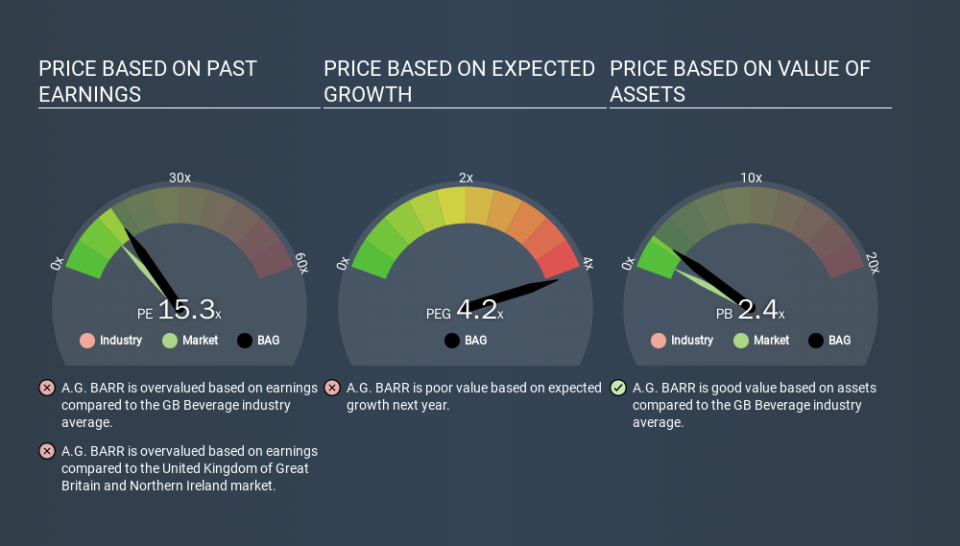
Today, we'll introduce the concept of the P/E ratio for those who are learning about investing. To keep it practical, we'll show how A.G. BARR p.l.c.'s (LON:BAG) P/E ratio could help you assess the value on offer. Looking at earnings over the last twelve months, A.G. BARR has a P/E ratio of 15.27. That means that at current prices, buyers pay £15.27 for every £1 in trailing yearly profits.
View our latest analysis for A.G. BARR
How Do I Calculate A Price To Earnings Ratio?
The formula for price to earnings is:
Price to Earnings Ratio = Share Price ÷ Earnings per Share (EPS)
Or for A.G. BARR:
P/E of 15.27 = £4.330 ÷ £0.284 (Based on the year to July 2019.)
(Note: the above calculation results may not be precise due to rounding.)
Is A High Price-to-Earnings Ratio Good?
A higher P/E ratio implies that investors pay a higher price for the earning power of the business. That isn't a good or a bad thing on its own, but a high P/E means that buyers have a higher opinion of the business's prospects, relative to stocks with a lower P/E.
Does A.G. BARR Have A Relatively High Or Low P/E For Its Industry?
We can get an indication of market expectations by looking at the P/E ratio. The image below shows that A.G. BARR has a P/E ratio that is roughly in line with the beverage industry average (14.6).
A.G. BARR's P/E tells us that market participants think its prospects are roughly in line with its industry. The company could surprise by performing better than average, in the future. Checking factors such as director buying and selling. could help you form your own view on if that will happen.
How Growth Rates Impact P/E Ratios
Companies that shrink earnings per share quickly will rapidly decrease the 'E' in the equation. Therefore, even if you pay a low multiple of earnings now, that multiple will become higher in the future. Then, a higher P/E might scare off shareholders, pushing the share price down.
A.G. BARR saw earnings per share decrease by 10% last year. But over the longer term (5 years) earnings per share have increased by 1.1%. And it has shrunk its earnings per share by 4.4% per year over the last three years. This growth rate might warrant a low P/E ratio.
Remember: P/E Ratios Don't Consider The Balance Sheet
One drawback of using a P/E ratio is that it considers market capitalization, but not the balance sheet. So it won't reflect the advantage of cash, or disadvantage of debt. In theory, a company can lower its future P/E ratio by using cash or debt to invest in growth.
Spending on growth might be good or bad a few years later, but the point is that the P/E ratio does not account for the option (or lack thereof).
How Does A.G. BARR's Debt Impact Its P/E Ratio?
A.G. BARR has net cash of UK£4.6m. That should lead to a higher P/E than if it did have debt, because its strong balance sheets gives it more options.
The Verdict On A.G. BARR's P/E Ratio
A.G. BARR's P/E is 15.3 which is above average (11.8) in its market. Falling earnings per share is probably keeping traditional value investors away, but the net cash position means the company has time to improve: and the high P/E suggests the market thinks it will.
When the market is wrong about a stock, it gives savvy investors an opportunity. As value investor Benjamin Graham famously said, 'In the short run, the market is a voting machine but in the long run, it is a weighing machine. So this free visual report on analyst forecasts could hold the key to an excellent investment decision.
You might be able to find a better buy than A.G. BARR. If you want a selection of possible winners, check out this free list of interesting companies that trade on a P/E below 20 (but have proven they can grow earnings).
If you spot an error that warrants correction, please contact the editor at editorial-team@simplywallst.com. This article by Simply Wall St is general in nature. It does not constitute a recommendation to buy or sell any stock, and does not take account of your objectives, or your financial situation. Simply Wall St has no position in the stocks mentioned.
We aim to bring you long-term focused research analysis driven by fundamental data. Note that our analysis may not factor in the latest price-sensitive company announcements or qualitative material. Thank you for reading.
